Depersonalization & Derealization in Rural Areas: Prevalence Study
advertisement
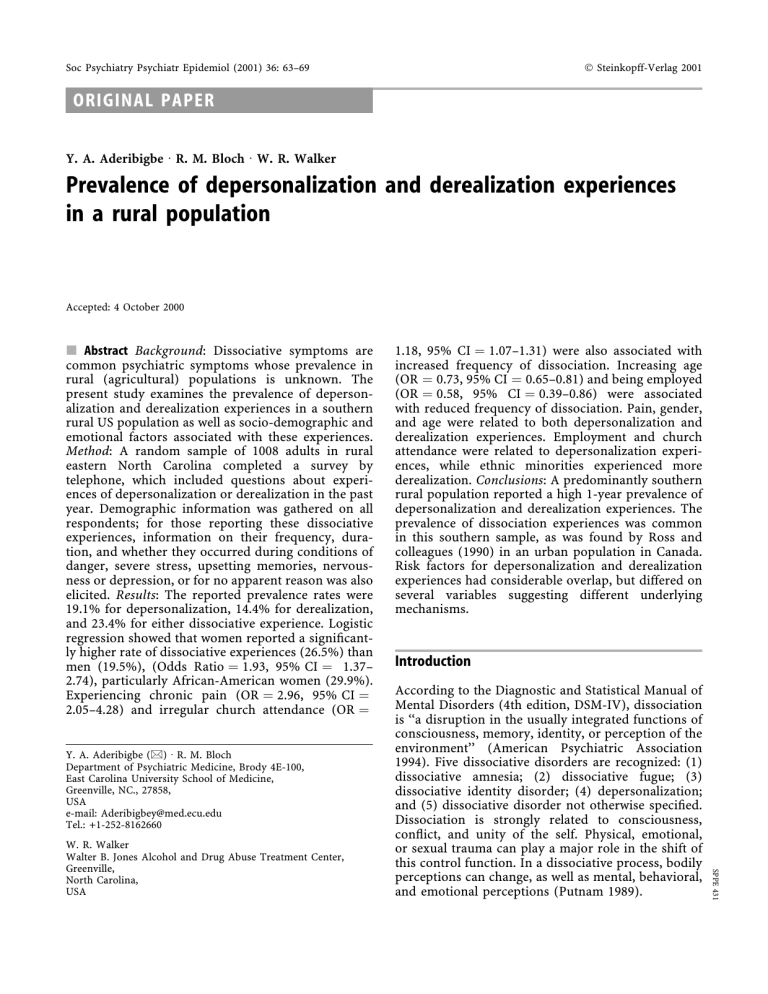
Soc Psychiatry Psychiatr Epidemiol (2001) 36: 63±69 Ó Steinkopff-Verlag 2001 ORIGINAL PAPER Y. A. Aderibigbe á R. M. Bloch á W. R. Walker Prevalence of depersonalization and derealization experiences in a rural population Accepted: 4 October 2000 j Abstract Background: Dissociative symptoms are common psychiatric symptoms whose prevalence in rural (agricultural) populations is unknown. The present study examines the prevalence of depersonalization and derealization experiences in a southern rural US population as well as socio-demographic and emotional factors associated with these experiences. Method: A random sample of 1008 adults in rural eastern North Carolina completed a survey by telephone, which included questions about experiences of depersonalization or derealization in the past year. Demographic information was gathered on all respondents; for those reporting these dissociative experiences, information on their frequency, duration, and whether they occurred during conditions of danger, severe stress, upsetting memories, nervousness or depression, or for no apparent reason was also elicited. Results: The reported prevalence rates were 19.1% for depersonalization, 14.4% for derealization, and 23.4% for either dissociative experience. Logistic regression showed that women reported a signi®cantly higher rate of dissociative experiences (26.5%) than men (19.5%), (Odds Ratio 1.93, 95% CI 1.37± 2.74), particularly African-American women (29.9%). Experiencing chronic pain (OR 2.96, 95% CI 2.05±4.28) and irregular church attendance (OR Y. A. Aderibigbe (&) á R. M. Bloch Department of Psychiatric Medicine, Brody 4E-100, East Carolina University School of Medicine, Greenville, NC., 27858, USA e-mail: Aderibigbey@med.ecu.edu Tel.: +1-252-8162660 Introduction According to the Diagnostic and Statistical Manual of Mental Disorders (4th edition, DSM-IV), dissociation is ``a disruption in the usually integrated functions of consciousness, memory, identity, or perception of the environment'' (American Psychiatric Association 1994). Five dissociative disorders are recognized: (1) dissociative amnesia; (2) dissociative fugue; (3) dissociative identity disorder; (4) depersonalization; and (5) dissociative disorder not otherwise speci®ed. Dissociation is strongly related to consciousness, con¯ict, and unity of the self. Physical, emotional, or sexual trauma can play a major role in the shift of this control function. In a dissociative process, bodily perceptions can change, as well as mental, behavioral, and emotional perceptions (Putnam 1989). SPPE 431 W. R. Walker Walter B. Jones Alcohol and Drug Abuse Treatment Center, Greenville, North Carolina, USA 1.18, 95% CI 1.07±1.31) were also associated with increased frequency of dissociation. Increasing age (OR 0.73, 95% CI 0.65±0.81) and being employed (OR 0.58, 95% CI 0.39±0.86) were associated with reduced frequency of dissociation. Pain, gender, and age were related to both depersonalization and derealization experiences. Employment and church attendance were related to depersonalization experiences, while ethnic minorities experienced more derealization. Conclusions: A predominantly southern rural population reported a high 1-year prevalence of depersonalization and derealization experiences. The prevalence of dissociation experiences was common in this southern sample, as was found by Ross and colleagues (1990) in an urban population in Canada. Risk factors for depersonalization and derealization experiences had considerable overlap, but differed on several variables suggesting different underlying mechanisms. 64 The frequency and severity of dissociative experiences and disorders vary widely, ranging from common experiences, such as daydreaming, to unusual DSM-IV (American Psychiatric Association 1994) axis I pathology. In addition to the dissociative disorders, dissociative symptoms can be seen in various psychopathological diagnoses such as schizophrenia, affective, panic, post traumatic stress, substance abuse and personality disorders (DSMIV). There are several studies that have examined the prevalence of dissociative experiences in the general population, with reported prevalence rates of between 5 and 11% for dissociative experiences (Ross et al. 1990; Vanderlinden et al. 1993; Loewestein 1994). Ross and colleagues (1990) conducted a threestage, strati®ed random sample of 1055 adults in the city of Winnipeg, Canada. The ®rst phase of their study used scores on the Dissociative Experience Scale (DES; Berstein and Putnam 1986). During the second phase of the study, 454 of the initial respondents were interviewed using the Dissociative Disorder Interview Schedule (DDIS; Ross et al. 1986) by interviewers blind to the results of the ®rst phase. The mean DES score was found to be 10.8 and the median score was 7.0. Five percent, 8.4%, and 12.8% of their population had DES scores of above 30, 25 and 20, respectively. They argued that scores above 20 are indicative of a substantial number of dissociative experiences in an individual's life. They found that dissociative experiences were equally common in men and women; that dissociative experiences decline with age; and that dissociation is independent of all major socio-economic factors other than age, income, education, employment, and religion. In another study of Canadian college students, Ross and colleagues (1991) found that 15.4% of their sample had DES scores over 20, and that the median DES score for a sample of Canadian junior-high school students was 17.7. There are also studies of dissociative experiences among US American collegestudent populations (Frischolz et al. 1991; Kihlstrom et al. 1994; Murphy 1994; Sanders and Green 1994). Murphy (1994) found that 8.9% of a non-clinical university population had dissociative experiences. Kihlstrom and colleagues (1994) found that 19% and 6% of a sample of university students had DES scores greater than 20 and 30 respectively. These results suggest that the prevalence rate of dissociative experiences in the general population ranges from 5% to 20%. Walker and colleagues (1996) found that dissociative experiences, as measured by DES scores, are less common in psychiatric patients as age increases, and are decreased with impaired cognitive functioning. This suggests that dissociative experiences depend on intact cognitive functioning. Steinberg (1995) identi®ed characteristics associated with mild nonpathological depersonalization and severe depersonalization. Severe depersonalization was characterized by episodes that persist longer that 24 h or that occur daily or weekly. Severe depersonalization was also considered present if there were ®ve or more episodes which were accompanied by any of the following: impaired functioning; duration longer than 4 h; were not precipitated by stress; or were associated with dysphoria or traumatic memory. In contrast, mild depersonalization was characterized by experiencing less than ®ve episodes that last no longer than 4 h and which are usually associated with stress or fatigue. As a symptom, depersonalization is very common in the general population; approximately half of all adults have experienced a brief episode of depersonalization that is usually brought on by stress or trauma. It is the third most common psychiatric symptom after depression and anxiety (Coons 1998). Despite its frequency, to the best of the authors' knowledge, there are no reported prevalence studies of depersonalization or other dissociative experiences in rural (agricultural) populations. The present study examines the prevalence of depersonalization and derealization experiences in a southern rural US, population. It also examines the socio-demographic and emotional factors associated with these experiences. Subjects and methods Each summer the Regional Development Services Survey Research Laboratory of East Carolina University conducts a telephone survey of over 1000 households in eastern North Carolina. The region covered is mostly rural, with 25 of the 44 sampled counties having populations under 50,000. Only six counties had populations over 100,000. Random digit dialing was used by Survey Sampling, Inc. to ensure random sampling of the 717,118 households that have telephones (91% of the population) in the survey area. The sample was collected in the late summer and early fall of 1995. If no one answered the telephone, the same number would be tried again on another day for up to three more attempts before choosing another number to replace it. Once someone answered the telephone in the household, a random selection was used to identify which adult member of the household to question. If that household member was not available (i.e., the oldest female) the next available adult would be requested. This helped to establish a distribution of ages and genders. A total of 1476 numbers were dialed, which produced 1048 (71%) non-business residences with adults available to complete the survey. A total of 1008 of these (96%) agreed to complete the survey. Two dissociative symptoms, depersonalization and derealization, were operationally de®ned according to DSM-IV (American Psychiatric Association 1994). As part of the survey, each respondent was asked about depersonalization experiences with the question: ``Sometimes people feel as though they are outside themselves, watching themselves do something; feel as if their body doesn't quite belong to them, like a robot, or feel like they are in a daze or a dream. Have you had any of these feelings within the last 65 year?'' To assess derealization, respondents were asked: ``Sometimes people feel as though other people or objects around them appear strange or changed in some way: that their surroundings are not quite real. Have you had any of these feelings in the last year?'' For people who acknowledged experiencing either symptom, estimates of frequency and duration of experiences were also gathered. In addition, people who experienced either symptom were asked whether they experienced the symptom during periods of danger, of stress, of recalling upsetting memories, of nervousness or depression, or for no particular reason. All of these questions related to dissociative experiences were yes/no questions, which had ``don't know'' and ``no answer'' options. Only respondents who answered ``yes'' to experiencing depersonalization or derealization were subsequently asked about the circumstances of these experiences. For all questions on dissociative experiences, respondents who chose ``don't know'' or chose to not answer these questions were combined with those who answered ``no'' to ensure a conservative estimate of the proportion of respondents who acknowledged a particular experience. Responses of ``yes'' or ``no'' were not applicable to the demographic variables, and the ``don't know'' and ``no answer'' choices were treated as missing values. Demographic variables collected included: age, sex, race, education, employment status, marital status, income, and number of children in the household. These demographic variables, along with measures of frequency of church attendance, strength of religious beliefs, and experiencing chronic pain of at least 3 months' duration were tested for their relationship to experiencing either dissociative symptom. Table 1 Demographic frequencies and 1-year prevalence of dissociative experiences in eastern North Carolina sample, presented as absolute numbers, with percentages in parentheses j Data analysis The 1-year prevalences of depersonalization and derealization were computed based on the proportion of all survey respondents who acknowledged experiencing these symptoms. The relationships of the demographic and other predictive variables to the experience of dissociative symptoms were explored with logistic regressions. Logistic regressions were performed to identify variables associated with depersonalization experiences, derealization experiences, and reporting either experience. Individual comparisons on categorical or ordinal variables were performed using chi-square tests, while independent T-tests were used for individual comparisons on interval variables. All statistical tests were performed using SIMSTAT v.1.3 (1996) with the ELOGIT.EXE addin used for the logistic regressions. Results of the logistic regressions are presented as adjusted odds ratios (OR) with the 95% con®dence intervals (CI). Results Table 1 shows the number and proportion of respondents in each of the various sociodemographic categories. The majority of the respondents were Caucasian (69.1%), female (56.2%), and were married (57.0%). The average age of the sample was 44.26 Total sample Depersonalization Derealization Either dissociation Gender Men Women Total 442 (43.80) 566 (56.20) 1008 (100) 70 (15.80) 123 (21.70) 193 (19.30) 54 (12.20) 91 (16.10) 145 (14.40) 86 (19.50) 150 (26.50) 236 (23.40) Age 18±22 23±28 29±35 36±45 46±60 61±75 76±90 Total 105 (10.50) 114 (11.40) 146 (14.50) 196 (19.50) 236 (23.50) 172 (17.10) 35 (3.50) 1004 (100) 33 (31.40) 25 (21.90) 37 (25.30) 47 (24.00) 35 (14.80) 12 (7.00) 2 (5.70) 191 (19.00) 31 (29.50) 19 (16.70) 30 (20.50) 32 (16.30) 25 (10.60) 7 (4.10) 1 (2.90) 145 (14.40) 40 (38.10) 32 (28.10) 44 (30.10) 56 (28.60) 43 (18.20) 17 (9.90) 2 (5.70) 234 (23.30) Education Some high school High school graduate Some post high school College graduate Some post course Graduate degree Total 147 (14.60) 319 (31.60) 345 (34.20) 120 (11.90) 17 (1.70) 60 (6.00) 1008 (100) 21 (14.30) 60 (18.80) 88 (25.50) 16 (13.30) 4 (23.50) 4 (6.70) 193 (19.10) 17 (11.60) 53 (16.60) 62 (18.00) 11 (9.20) 2 (11.80) 0 (0.00) 145 (14.40) 29 (19.70) 76 (23.80) 99 (28.70) 23 (19.20) 5 (29.40) 4 (6.70) 236 (23.40) Marital status Married Never married Divorced Separated Widowed Living together Total 575 (57.00) 182 (18.10) 93 (9.20) 38 (3.80) 91 (9.00) 29 (2.90) 1008 (100) 99 (17.20) 34 (18.70) 28 (30.10) 11 (28.90) 7 (7.70) 14 (48.30) 193 (19.10) 61 (10.60) 39 (21.40) 22 (23.70) 9 (23.70) 6 (6.60) 8 (27.60) 145 (14.40) 118 (20.50) 46 (25.30) 32 (34.40) 14 (36.80) 11 (12.10) 15 (51.70) 236 (23.40) Race African±Americans Caucasians Others Total 245 (24.50) 692 (69.10) 64 (6.40) 1001 (100) 44 (18) 129 (18.60) 19 (29.70) 192 (19.20) 48 (19.60) 78 (11.30) 18 (28.10) 144 (14.40) 64 (25.10) 150 (21.70) 20 (31.30) 234 (23.40) 66 years, ranging from 18 to 88 years of age. Almost half (54%) reported having some college education, with the remaining 46% reporting either having completed some high school or having ®nished high school. The average annual reported household income was close to $25,000. The 1-year prevalence rates of depersonalization and derealization are also presented in Table 1. Of the total respondents, 193 (19.1%) and 145 (14.4%) reported experiencing depersonalization and derealization respectively. Combined, a total of 236 (23.4%) respondents reported experiencing either depersonalization or derealization during the preceding year. A logistic regression measured the relationships between each of the demographic and context predictor variables and the experience of either dissociative symptom. Of the 11 initial predictor variables, ®ve were signi®cantly related to experiencing dissociative symptoms, including age, sex, pain, church attendance, and number of children. These results were based on 860 respondents. Unlike the ®ndings reported by Ross et al. (1990) for Winnipeg, income was not related to either dissociative experience. Because a large number of respondents (n 102) declined to give income information, and leaving them out could bias the results, the logistic regression was repeated eliminating the income variable. This increased the number of respondents re¯ected to 949, or 94% of the sample. Age, sex, chronic pain, and church attendance continued to be signi®cantly related to experiencing dissociative symptoms (P < 0.01). Employment status became marginally signi®cant (P < 0.05), while number of children (OR 1.14, CI 0.99±1.30 became marginally nonsigni®cant (P 0.06). Increasing age showed the same inverse relationship to dissociative symptoms (OR 0.97, CI 0.96±0.98) as previously reported (Walker et al. 1996), in that older respondents were less likely to report dissociative symptoms. Females reported dissociative symptoms more frequently than Table 2 Multivariable logistic regression using sociodemographic factors Variable Employment (full or part-time work) Chronic pain (presence of pain) Gender (female gender) Religious beliefs (strong beliefs) Church attendance (low frequency) Age (older) Children (larger number of children) Ethnicity (Hispanic/Native Am.) Education (more education) Marital status (unmarried, divorced) *P < 0.05; **P < 0.01 males (OR 1.93, CI 1.36±2.73), while respondents reporting chronic pain were almost three times more likely to report dissociative symptoms than those who did not (OR 2.92, CI 2.03±4.22). Church attendance was measured in seven categories, ranging from more than once per week to less than once per year. The less frequent the reported church attendance, the more likely the respondent reported dissociative symptoms (OR 1.16, CI 1.04±1.28). The fact that reported strength of religious belief was not associated with dissociative symptoms (OR 0.90, CI 0.67±1.20), suggests that the social aspects of church attendance may be related to the decreased reports of dissociative symptoms. Thirteen categories of employment status were combined into two levels of employment: employed (full or part-time or in the military) versus unemployed (student, housewife, retiree, disabled, or looking for work while not working). Respondents who were employed were more likely to report dissociative symptoms (OR 1.53, CI 1.03±2.28). Similar logistic regressions were performed with the same ten predictor variables for depersonalization and derealization independently to see whether they were differentially predicted. Interestingly, chronic pain, gender, and age were signi®cantly related to reports of both depersonalization and derealization experiences (see Table 2). Chronic pain almost tripled the likelihood of experiencing depersonalization and doubled the likelihood of reporting derealization. Female gender and lower age were also each associated with increased likelihood of reporting both experiences. Employment was related to increased likelihood of depersonalization experiences, as was increasing numbers of children, while frequent church attendance reduced the likelihood of reporting depersonalization. These variables were not related to the likelihood of reporting derealization experiences, which were associated with increased education level and marital statuses other than married. People who are employed and have more education may have a Depersonalization Derealization Odds ratio 95% CI Odds ratio 95% CI 1.62* 2.93** 1.96** 0.86 1.20** 0.97** 1.17* 1.36 0.95 1.18 1.06±2.49 1.99±4.33 1.35±2.85 0.63±1.18 1.08±1.34 0.96±0.98 1.02±1.35 0.98±1.90 0.81±1.11 0.81±1.73 1.15 2.08** 1.74* 0.99 1.02 0.96** 1.16 1.10 0.83 1.72* 0.72±1.82 1.34±3.21 1.14±2.65 0.69±1.41 0.90±1.15 0.95±0.97 1.00±1.35 0.77±1.60 0.68±1.00 1.13±2.62 67 tendency for higher cognitive function that may predispose them to having more dissociative experiences. The dissociative symptoms were associated with various mood and situational conditions. Of the 236 respondents who reported either depersonalization or derealization symptoms, 207±209 gave answers to the questions regarding the conditions in which these symptoms occurred, with 27±29 (12%) either not responding or unsure. Of those responding, 25% reported that the dissociative experiences tended to happen when something dangerous happened to them. This was the least common condition associated with dissociative experiences. The most common condition associated with dissociative experiences was when something severely stressful happened (78%). Dissociation occurred at intermediate frequencies in response to upsetting memories of something that happened (45%), when the respondent was nervous or depressed (66%), and for no particular reason (35%). Associating the ®ve mood and context variables to depersonalization and derealization experiences suggested that the two experiences tended to be elicited in association with different situations. Logistic regressions were performed with the data from respondents who experienced either symptom. Table 3 shows the adjusted odds ratios and con®dence intervals for the association of each of the mood/context variables with the likelihood of depersonalization and derealization experiences. Depersonalization tended to be experienced in conditions of high stress, and nervousness or depression, although not quite signi®cantly. Derealization tended to occur with danger, for no particular reason, and suggestively with disturbing memories. The ten demographic predictor variables used above were entered into logistic regressions to examine variables that predict the respondents who experience dissociative symptoms in each of the mood and context conditions. Using data from only those who reported depersonalization or derealization experiTable 3 Logistic regression associating mood and context (OR adjusted odds ratio) Symptom happened Depersonalization Derealization OR When something dangerous happened When something severely stressful happened When upsetting memories happened When nervous or depressed Anytime for no reason *P < 0.05 95% CI OR 95% CI 0.48 0.21±1.12 2.51* 1.07±5.86 2.33 0.96±5.63 0.59 0.25±1.41 1.18 0.53±2.66 2.17 0.98±4.80 0.98 0.45±2.12 1.96 0.99±3.88 1.00 0.47±2.10 2.27* 1.09±4.72 ences, logistic regressions showed that predictor variables differed dramatically between the emotional contexts. For predicting who would tend to experience dissociation symptoms when something dangerous happened, race was marginally signi®cant (OR 1.81, CI 1.00±3.29; P 0.05). Only 21% of AfricanAmerican respondents who reported experiencing dissociative symptoms reported that these tended to occur in dangerous situations, while 25% of Caucasian respondents and 40% of the composite of Hispanic, Native American, and other ethnic respondents did. Experiencing dissociative symptoms when something severely stressful happened was negatively associated with age (OR 0.96, CI 0.93±0.99), was far more common in women (OR 5.47, CI 2.25±13.33), and was related to race (OR 3.62, CI 1.56±8.40), being more frequent among the ``other'' minorities (90%) than among African-Americans (72%) or Caucasians (79%). Among respondents whose dissociative experiences tended to occur when they had an upsetting memory, only non-married marital status was predictive (OR 2.31, CI 1.18±4.55). For respondents whose dissociative experience occurred when nervous or depressed, only education level was related (OR 0.64, CI 0.46±0.90), with more education making it less likely. Finally, none of the predictor variables was related to reporting that dissociative symptoms occurred for no particular reason. The conditions that accompanied the dissociative symptoms and the demographic variables were examined for their relationship to measures of symptom frequency and duration. Overall, 197 of the 236 individuals (83%) who experienced depersonalization or derealization in the last year provided estimates on how frequently they experienced these symptoms. The average frequency reported was 26.15 times, with a range of 1±365. Among the predictor variables, only the gender effect was signi®cant, with women reporting signi®cantly lower frequencies of occurrence (M 14.7) compared to men (M 46.7, t 2.50, P 0.01). No variables were related to reported symptom duration. Respondents whose duration of dissociative experience was greater than 1 h, or whose frequency of experience in the last year was three or more occasions, were thought to have a more substantial report of dissociative experiences. Of the 236 respondents with dissociative experiences, 188 (80%) reported frequencies or durations indicating more substantial experiences. This represents 19% of the total sample. Discussion In this study, we estimated the prevalence rates of depersonalization and derealization in a rural population sample. This study of 1008 residents is believed 68 to be the largest epidemiological survey of dissociative symptoms among a rural population that has been conducted. Twenty-three percent of the sample reported experiencing depersonalization or derealization in the preceding year. Nineteen percent reported more than one or two experiences, or experiences lasting longer than 1 h. This prevalence rate is higher than the 11% that was reported by Ross et al. (1990) in a Canadian general population study. The difference may be as a result of differences in methodology. Unlike the previous studies by Ross and colleagues (1990, 1991), this study did not use the DES screening instrument or structured clinical interview for dissociative experiences. The criteria for scoring greater than 20 on the DES may be a more stringent level than the frequency and duration criteria chosen in the current study. Furthermore, our study was a telephone survey, so there was no face-to-face discussion. This may have been experienced as providing privacy so that respondents may have felt more comfortable in admitting these experiences. On the other hand, the questions were directly based on DSM-IV de®nitions of depersonalization and derealization experiences and had at least facevalidity. This study replicated the DES-based ®ndings of Walker and colleagues (1996), which showed that the frequency of dissociative experiences decreases as age increases. The results of the current study also replicated previously reported relationships between DES indices of dissociative symptoms and employment and religion (Ross 1991). In the present study, there was statistically signi®cant evidence that a higher proportion of women than men had dissociative experiences. Ross has previously found that men and women were equally likely to experience dissociation (Ross et al. 1986). It is not clear whether the higher proportion of women reporting dissociative experiences was related to the methodology used in this study, to differences between the geographic regions studied, or to a true general difference. This ®nding should be replicated. Although depersonalization and derealization are currently regarded as independent constructs (Fleiss et al. 1975), derealization is also seen in a signi®cant percentage of individuals who have depersonalization. Studies of the factor structure of the DES in nonclinical populations have produced varying results. Ross and colleagues obtained a three-factor solution in their random sample of the general population. Their factors were named Absorption±Imaginative Involvement, Activities of Dissociated States, and Depersonalization±Derealization. Carlson and Putnam (1993) also obtained three factors in their nonclinical sample. They named these Absorption± Changeability, Depersonalization±Derealization, and Amnestic Experiences. The common factor descrip- tions of depersonalization and derealization suggest that they have common mediators or relationships with risk factors. The current study did show considerable overlap in the risk factors associated with depersonalization and derealization. Age, gender, and pain were consistently related to both. On the other hand, several variables including employment, number of children, church attendance, education level, and marital status were signi®cantly related to one but not both types of experience. It is possible that these relationships re¯ect one or more underlying mediators, which are different for the two types of experiences. This suggestion of different mediators is supported by the different relationships of the mood and context variables with depersonalization and derealization. Depersonalization tended to be weakly associated with severe stress and with nervousness or depression, which were not associated with derealization. Derealization was signi®cantly associated with danger and occurrence for no particular reason, which were not associated with depersonalization. The survey method used may have contributed to the different relationships with the dissociative symptoms shown by some of the variables. It is possible that there was not enough power to demonstrate common, but relatively weak relationships. The strong relationships for chronic pain, gender, and age were consistent across symptoms. In particular, it is clear that, of the variables examined, chronic pain is the most important risk factor for dissociative symptoms. Dissociative experiences, as re¯ected in the current study, may be very common in southern rural populations. It is not clear, however, whether dissociative disorders are correspondingly more common in this population. The current study points to a need for studies of dissociative experiences and disorders in southern and rural populations using established diagnostic methods. If the current ®ndings are replicated, it will also be important to study the factors that are responsible for the high prevalence of these experiences in southern rural populations. References American Psychiatric Association (1994) Diagnostic and Statistical Manual of Mental Disorders, 4th edn. American Psychiatric Press, Washington, DC Bernstein EM, Putnam FW (1986) Development, reliability and validity of a dissociation scale. J Nerv Ment Dis 174: 727±735 Carlson EB, Putnam FW (1993) An update on the Dissociative Experience Scale. Dissociation 6: 16±27 Coons PM (1998) The dissociative disorders: rarely considered and underdiagnosed. Psychiatr Clin North Am 21: 637±647 Fleiss JL, Gurland BJ, Goldberg K (1975) Independence of depersonalization±derealization. J Consult Clin Psychol 43: 110±111 69 Frischholz ET, Braun BG, Sachs RG, Schartz DR, Lewis J, Shaeffer D, Westergaard C, Pasquotto J (1991) Constructive validity of the Dissociative Experience Scale (DES): the relationship between the DES and other self-report measures of dissociation. Dissociation 4: 185±188 Kihlstrom JF, Gilsky ML, Angiulo MJ (1994) Dissociative tendencies and dissociation disorders. J Abnorm Psychol 103: 117±124 Loewenstein RJ (1994) Diagnosis, epidemiology, clinical course, treatment and cost effectiveness of treatment for dissociative disorders and MPD. Reports submitted to the Clinton Administration Task Force on Health Care Financing Reform. Dissociation 7: 3±12 Lynn SJ, Rhue JW (1994) Dissociation: clinical and theoretical perspectives. Guilford Press, New York Merskey H (1995) The manufacture of personalities: the production of multiple personality disorders. In: a Cohen LM, Berzoff JN, Elin MR (eds) Dissociative Identity Disorder: theoretical and treatment. Aronson, Northvale, pp. 3±32 Murphy PE (1994) Dissociative experiences and dissociative disorder in a non-clinical university student group. Dissociation 7: 28±34 Putnam FW (1989) Diagnosis and treatment of multiple personality disorder. Guilford Press, New York Ross CA, Ryan L, Anderson G, Ross D, Hardy L (1989) Dissociative experiences in adolescents and college students. Dissociation 2: 239±242 Ross CA, Joshi S, Currie R (1990) Dissociative experiences in the general population. Am J Psychiatry 147: 1547±1552 Ross CA, Ryan L, Voight H, Eide L (1991) High and low dissociators in a college student population. Dissociation 4: 147±151 Sanders B, Green J (1994) The factor structure of the Dissociative Experiences Scale in college Students. Dissociation 8: 23±27 Steinberg M (1995) Handbook for the assessment of dissociation: a clinical guide. APA Press, Washington, DC Vanderlinden J, VanDyck R, Vandereycken W, Vertommen H (1993) Dissociation and traumatic experiences in the general population of the Netherlands. Hosp Community Psychiatry 44: 786±788 Walker R, Gregory F, Oakley S, Bloch R, Gardner M (1996) Reduction in dissociation due to aging and cognitive de®cit. Comp Psychiatry 37: 31±36

