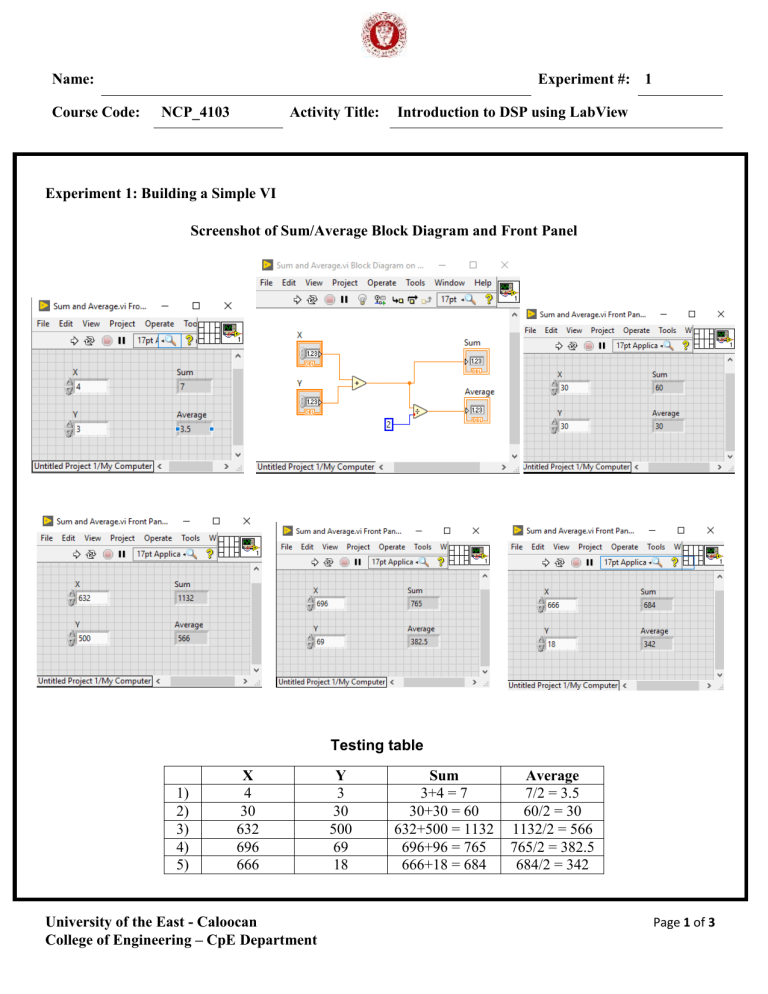
Name: Course Code: Experiment #: 1 NCP_4103 Activity Title: Introduction to DSP using LabView Experiment 1: Building a Simple VI Screenshot of Sum/Average Block Diagram and Front Panel Testing table 1) 2) 3) 4) 5) X 4 30 632 696 666 University of the East - Caloocan College of Engineering – CpE Department Y 3 30 500 69 18 Sum 3+4 = 7 30+30 = 60 632+500 = 1132 696+96 = 765 666+18 = 684 Average 7/2 = 3.5 60/2 = 30 1132/2 = 566 765/2 = 382.5 684/2 = 342 Page 1 of 3 Experiment 2: SubVI Creation Screenshot of AddExample Block Diagram and Front Panel Testing table 1) 2) 3) 4) 5) X 8 36 31 399 2333 University of the East - Caloocan College of Engineering – CpE Department Y 9 9 234 254 5033 Sum 8+9 = 17 36+9 = 45 31+234 = 265 399+254 = 653 2333+5033 = 7366 Page 2 of 3 Observation: The interface of the LabVIEW was easy to understand so I was able to do the given step of the for this experiment. Exploring the interface of the block diagram and front panel is a lot of fun when you are able to run the circuit properly at first try. I think doing this experiment will help us to deeply appreciate the concept of studying the digital signal processing laboratory and make us to be a better computer engineer in the future. Screenshots of the Selfie while working with the experiments: Screenshots while presenting it to your professor: University of the East - Caloocan College of Engineering – CpE Department Page 3 of 3


