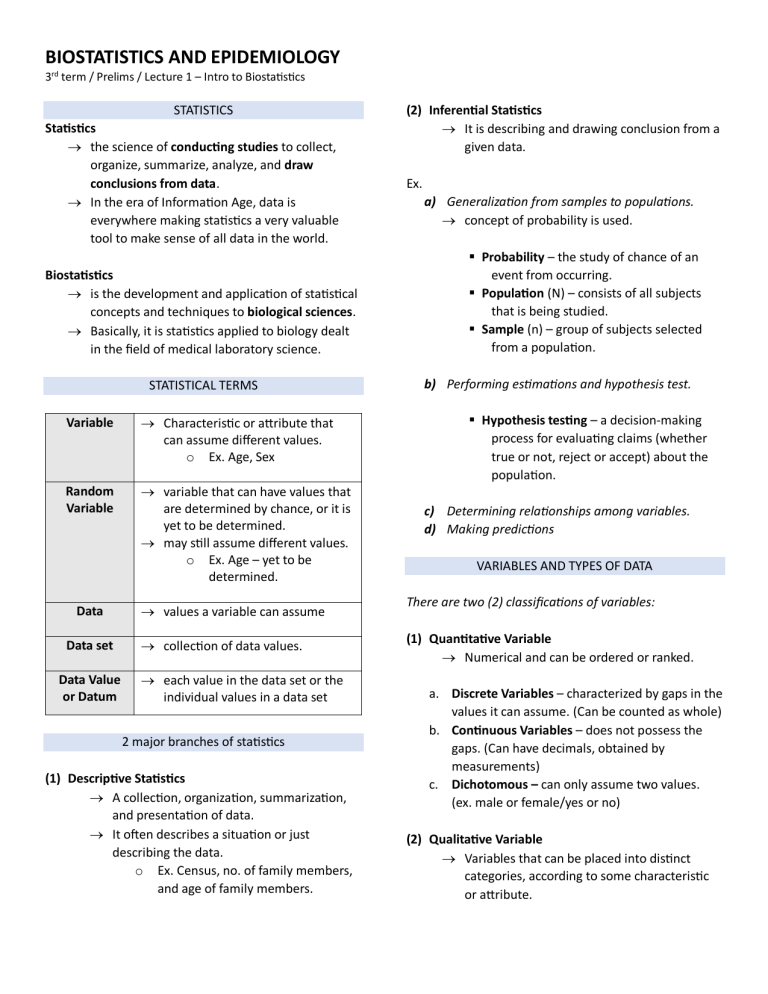
BIOSTATISTICS AND EPIDEMIOLOGY 3rd term / Prelims / Lecture 1 – Intro to Biostatistics STATISTICS Statistics → the science of conducting studies to collect, organize, summarize, analyze, and draw conclusions from data. → In the era of Information Age, data is everywhere making statistics a very valuable tool to make sense of all data in the world. Biostatistics → is the development and application of statistical concepts and techniques to biological sciences. → Basically, it is statistics applied to biology dealt in the field of medical laboratory science. STATISTICAL TERMS Variable → Characteristic or attribute that can assume different values. o Ex. Age, Sex Random Variable → variable that can have values that are determined by chance, or it is yet to be determined. → may still assume different values. o Ex. Age – yet to be determined. Data Data set Data Value or Datum (2) Inferential Statistics → It is describing and drawing conclusion from a given data. Ex. a) Generalization from samples to populations. → concept of probability is used. ▪ Probability – the study of chance of an event from occurring. ▪ Population (N) – consists of all subjects that is being studied. ▪ Sample (n) – group of subjects selected from a population. b) Performing estimations and hypothesis test. ▪ Hypothesis testing – a decision-making process for evaluating claims (whether true or not, reject or accept) about the population. c) Determining relationships among variables. d) Making predictions VARIABLES AND TYPES OF DATA → values a variable can assume There are two (2) classifications of variables: → collection of data values. (1) Quantitative Variable → Numerical and can be ordered or ranked. → each value in the data set or the individual values in a data set 2 major branches of statistics (1) Descriptive Statistics → A collection, organization, summarization, and presentation of data. → It often describes a situation or just describing the data. o Ex. Census, no. of family members, and age of family members. a. Discrete Variables – characterized by gaps in the values it can assume. (Can be counted as whole) b. Continuous Variables – does not possess the gaps. (Can have decimals, obtained by measurements) c. Dichotomous – can only assume two values. (ex. male or female/yes or no) (2) Qualitative Variable → Variables that can be placed into distinct categories, according to some characteristic or attribute. RECORDED VALUES AND BOUNDARIES Variable Length Temperature Time Mass • • Recorded Value 15 cm 86 oF 0.43 sec 1.6 g Boundaries 14.5 – 15.5 cm 85.5 – 86.5 oF 0.425 – 0.435 sec 1.55 – 1.65 g Since continuous variable must be measured, answers must be rounded off because of the limits of the measuring device. Creating boundaries: o the values should have 1 decimal place higher than the recorded value. o Always ends in 5. DATA COLLECTION • The sample should be representative of a whole population. Sources of data: - Routinely kept records. - Surveys - Experiments - External records SAMPLING TECHNIQUES Random Systematic MEASUREMENT SCALES (1) Nominal Level → classifies data into: o mutually exclusive (nonoverlapping) o exhausting categories (must ensure that all the samples will be measured; all possible responses are captured) o in which no order or ranking can be imposed on the data. → it is categorical in nature. → naming observations (2) Ordinal Level → Classifies data into categories that can be ranked; however, precise differences between the ranks do not exist. (3) Interval Level (quantitative) → Ranks data, and precise differences between units of measure do exist; however, there is no meaningful zero. (4) Ratio Level → Possesses all the characteristics of interval measurement, and there exists a true zero. → True ratios exist when the same variable is measured on two different members of the population. Stratified Cluster Subjects are selected by chance or random numbers. Subjects are selected by using every kth number after the first subject is randomly selected from 1 through k Subjects are selected by dividing up the population into groups by characteristics (strata), and subjects are randomly selected within groups. Population is divided into groups called clusters by some means like geographic area STATISTICAL STUDIES Observational study → Merely observes without intervention and tries to draw conclusions. → disadvantage: it can be done in situations where it would be unethical or downright dangerous to conduct an experiment because you are not manipulating the population. Experimental study → The researcher manipulates one of the variables (have control over the variable) and tries to determine how the manipulation influences other variables. → disadvantage: o they occur in an unnatural setting. o Hawthorne effect – subjects knew the experiment and try to change behavior. VARIABLES IN STATISTICAL STUDIES Independent variable (Explanatory variable) → Manipulated by the researcher. Dependent variable (Outcome variable) → Dependent on the independent variable → Resultant variable that is heavily affected by the independent variable. Confounding variable → It influences the dependent or outcome variable but was not separated from the independent variable. ˃ Ex. you found out that men who have lighters in their pockets have higher chances of having lung cancer, but it is the smoke from cigarette not the lighter. The lighter is the confounding variable because if they have cigarette, they have lighter in their pockets. → Role of researcher is to separate the confounding variable to independent variable. MISUSES OF STATISTICS o o o o o o o Suspect samples Ambiguous averages Changing the subject Detached statistics Implied connections Misleading graphs Faulty survey questions
