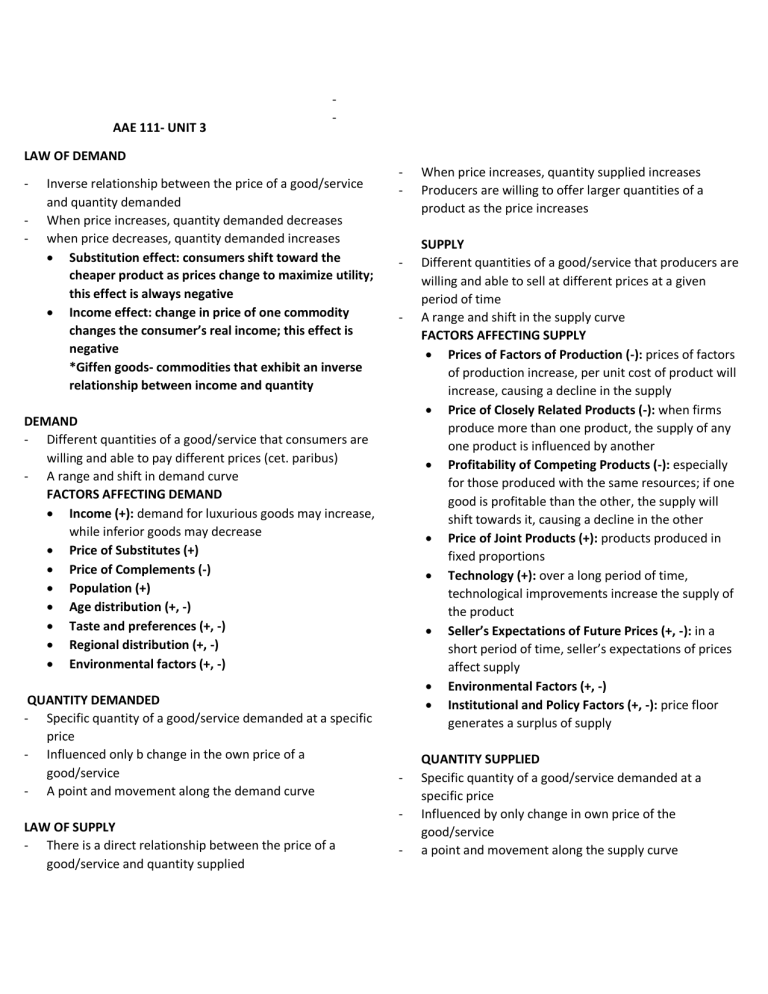
AAE 111- UNIT 3 - LAW OF DEMAND - Inverse relationship between the price of a good/service and quantity demanded When price increases, quantity demanded decreases when price decreases, quantity demanded increases Substitution effect: consumers shift toward the cheaper product as prices change to maximize utility; this effect is always negative Income effect: change in price of one commodity changes the consumer’s real income; this effect is negative *Giffen goods- commodities that exhibit an inverse relationship between income and quantity - - - DEMAND - Different quantities of a good/service that consumers are willing and able to pay different prices (cet. paribus) - A range and shift in demand curve FACTORS AFFECTING DEMAND Income (+): demand for luxurious goods may increase, while inferior goods may decrease Price of Substitutes (+) Price of Complements (-) Population (+) Age distribution (+, -) Taste and preferences (+, -) Regional distribution (+, -) Environmental factors (+, -) QUANTITY DEMANDED - Specific quantity of a good/service demanded at a specific price - Influenced only b change in the own price of a good/service - A point and movement along the demand curve LAW OF SUPPLY - There is a direct relationship between the price of a good/service and quantity supplied - When price increases, quantity supplied increases Producers are willing to offer larger quantities of a product as the price increases SUPPLY Different quantities of a good/service that producers are willing and able to sell at different prices at a given period of time A range and shift in the supply curve FACTORS AFFECTING SUPPLY Prices of Factors of Production (-): prices of factors of production increase, per unit cost of product will increase, causing a decline in the supply Price of Closely Related Products (-): when firms produce more than one product, the supply of any one product is influenced by another Profitability of Competing Products (-): especially for those produced with the same resources; if one good is profitable than the other, the supply will shift towards it, causing a decline in the other Price of Joint Products (+): products produced in fixed proportions Technology (+): over a long period of time, technological improvements increase the supply of the product Seller’s Expectations of Future Prices (+, -): in a short period of time, seller’s expectations of prices affect supply Environmental Factors (+, -) Institutional and Policy Factors (+, -): price floor generates a surplus of supply QUANTITY SUPPLIED Specific quantity of a good/service demanded at a specific price Influenced by only change in own price of the good/service a point and movement along the supply curve MARKET PRICE DETERMINATION - interaction of supply and demand that determines equilibrium price and quantity - Qd=Qs; equilibrium point where supply and demand intersect - It is stable and price has no tendency to fall/increase - - EQUILIBIRUM PRICE Price agreeable to both producers and consumers There is neither excess supply nor demand ELASTICITY - EQUILIBRIUM QUANTITY Quantity of goods producers and consumers are willing and able to produce/buy at equilibrium price MARKET DISEQUILIBRIUM SURPLUS/ EXCESS SUPPLY (Qs>Qd): quantity offered for sale exceeds quantity demanded SHORTAGE/ EXCESS DEMAND (Qs<Qd): quantity demanded is greater than what is supplied in the market Responsiveness of consumers/producers to price and income changes Ratio of relative change in quantity to a relative change in factor affecting demand/supply DEMAND AND SUPPLY ELASTICITIES OWN PRICE ELASTICITY OF DEMAND: responsiveness of quantity demanded for a good/service to a change in price INCOME ELASTICITY OF DEMAND: responsiveness of quantity demanded for a good/service to a change in income CROSS ELASTICITY OF DEMAND: responsiveness of quantity demanded for a good/service to a change in price of another good HOUSEHOLDFARM SIZE ELASTICITY OF DEMAND: responsiveness of quantity demanded for a good/service to a change in household/family size PRICE ELASTICITY OF SUPPLY: responsiveness of quantity demanded for a good/service to a change in price PRODUCTION FUNCTION MEASUREMENT OF DEMAND ELASTICITY TOTAL REVENUE/EXPENDITURE APPROACH: reflects the responsiveness of the consumers given the changes in price POINT ELASTICITY - - ARC ELASTICITY - - Amount of output produced by using different amounts of a variable input Physical/technical relationship between a variable input and output Shows the Total Physical Product (TPP); corresponding level of output produced by a technically feasible level of variable input Implies that the production of a specific commodity varies from one are to another because of several factors (topography, soil type, climate, etc.) Can be presented in the form of a table, graph of equation The short run production can be understood as the time period over which the firm is NOT ABLE TO CHANGE the quantities of all inputs. - - The long run production function indicates the time period, over which the firm CAN CHANGE the quantities of all the inputs. AVERAGE PHYSICAL PRODUCT (APP) quantity of output per unit of a variable input measures the contribution of each unit of input used the greater the APP, the higher the efficiency of the input in physical terms increases then decreases in value; always positive STAGES OF PRODUCTION STAGE 1 - Uneconomic stage of production because fixed inputs> variable input - Bound by the y-axis and the APP-MPP intersection where APP is at its maximum STAGE 2 - Bound by the APP-MPP intersection where TPP is at its maximum, MPP=0 - Rational stage or most profitable region STAGE 3 - Area where TPP is already downward sloping and MPP is negative - Irrational stage since increasing level of variable input decreases level of output - - MARGINAL PHYSICAL PRODUCT (MPP) Change in output for every unit change in a variable input Additional output that can be produced by adding one more unit of a specific variable unit Can have negative, positive or zero values LAW OF DIMINISHING MARGINAL RETURNS Happens to the MPP when additional units of a variable input are added to the fixed inputs MPP declines as additional units of a variable input are used in combination with fixed inputs Occurs because variable inputs> fixed inputs PROFIT MAXIMIZATION determining the optimum level of input or determining the level of output. - Concerned with the level of input use and the corresponding amount of output generated - MARGINAL VALUE PRODUCT: additional income received from using an additional unit of variable input; slope of total value MARGINAL FACTOR COST: additional cost incurred from using an additional unit of variable input; the price of the variable input - TOTAL APPROACH: approach computes for the profits by subtracting the TFC from the TVP. - MARGINAL APPROACH: indicates that the profitmaximizing level of input is thepoint where the MVP is equal to the MFC. - AVERAGE COST Total cost per unit of output U-shaped curve MARGINAL COST Additional cost incurred as additional unit of output is produced U-shaped curve AVERAGE VARIABLE COST Variable cost per unit of output U-shaped curve AVERAGE FIXED COST Fixed cost per unit output PROFIT MAXIMIZATION VARIABLE COST - Costs that vary with changes in output - Will not be incurred unless production takes place - Controlled in the short run FIXED COST - Associated with owning a fixed input or resource - Incurred even if the input is not used - Remain the same despite variation in output in the short run TOTAL APPROACH - Compute for the profits - Output corresponding to the maximum profit is the optimum level MARGINAL APROACH - Profit-maximizing level of output is when the MR, MC, and Price of output are all equal SSSSSSS SUPPLY CURVE - Based on marginal cost in relation to the price received when the product is sold Supply curve for the individual producer is the same as its MC curve Upward sloping portion of the MC curve that lies above the minimum AVC curve Consists of the series of profit maximizing points under alternative assumptions with respect to the marginal revenue or the price of the product ECONOMIC PRINCIPLES IN CHOOSING INPUT COMBINATIONS * In the short run production, it is economical to still continue operation even with such losses incurred * When the MR = MC is found below the minimum AVC, it is no longer economically to continue production. With no variable costs and fixed costs covered, the firm is better to shut down than to continue operation. LEAST COST COMBINATION OF INPUTS - - - - TOTAL APPROACH Input combination that will minimize total cost is selected MARGINAL APPROACH Cost is minimized if the value if added input is equal to the value of the saved input Inverse price ratio of the two inputs Principle of Resource Substitution: adoption should only considered when savings from the use of a new technology is greater than the additional cost of adopting it. Marginal Rate of Technical Substitution (MRTS): is the rate at which the two inputs (X1 and X2) are substituted to each other in the production of the same level of output slope of the isoquant=slope of isocost - - INPUT RELATIONSHIPS TECHNICAL SUSBTITUTES increase in one input results in a decrease in the other input while maintaining the same level of output Inputs compete with each other Negative MRTS Inputs that are very similar to each other a. Decreasing MRTS: inputs being increased substitutes for smaller amount of the inputs being replaced b. Constant MRTS: amount of input replaced b the other input does not change as the added input increases in magnitude c. Increasing MRTS: input being increased substitutes for successive larger amounts of the being replaced PERFECT COMPLEMENTS - Two inputs which combine in rigid or fixed proportions - No substitution is possible - Isoquant is a right angle * MARGINAL RATE OF PRODUCT TRANSFORMATION (MRPT) - rate at which one output can be substituted for or transformed to the production of the other output as the fixed set of resources are reallocated. - slope of the PPC PRODUCTION OF MORE THAN ONE PRODUCT *the physical relationship is not enough to determine the maximu-revenue combination of outputs MAXIMUM REVENUE COMBINATION OF OUTPUTS TOTAL APPROACH - Enterprise combination that will maixmize total revenue is selected - MARGINAL APPROACH Revenue is maximied if the value of added output is equal to the value of the reduced output Income gained= income lost ENTERPRISE RELATIONSHIPS 1. COMPETITIVE - Increasing production of one enterprise is only possible when the production of the other one is altered - Negative MRPT a. Constant Substitution Ratio - profit-maximizing solution will be to produce either all of one or all of the other enterprise – not as a combination. - PPC is a straight line b. Increasing Substitution Ratio - result in a production of a combination of enterprises. - Maximum revenue is where MRPT is equal to the inverse price ratio. 2. SUPPLEMENTARY - changing the production level of one of the outputs will not influence the production of the other. - the MPRT is equal to zero. 3. COMPLEMENTARY - increasing the production of one enterprise will simultaneously cause an increase in the production of another. - MRPT is positive. 4. JOINT PRODUCTS - Products that must be produced in a fixed ratio to each other

