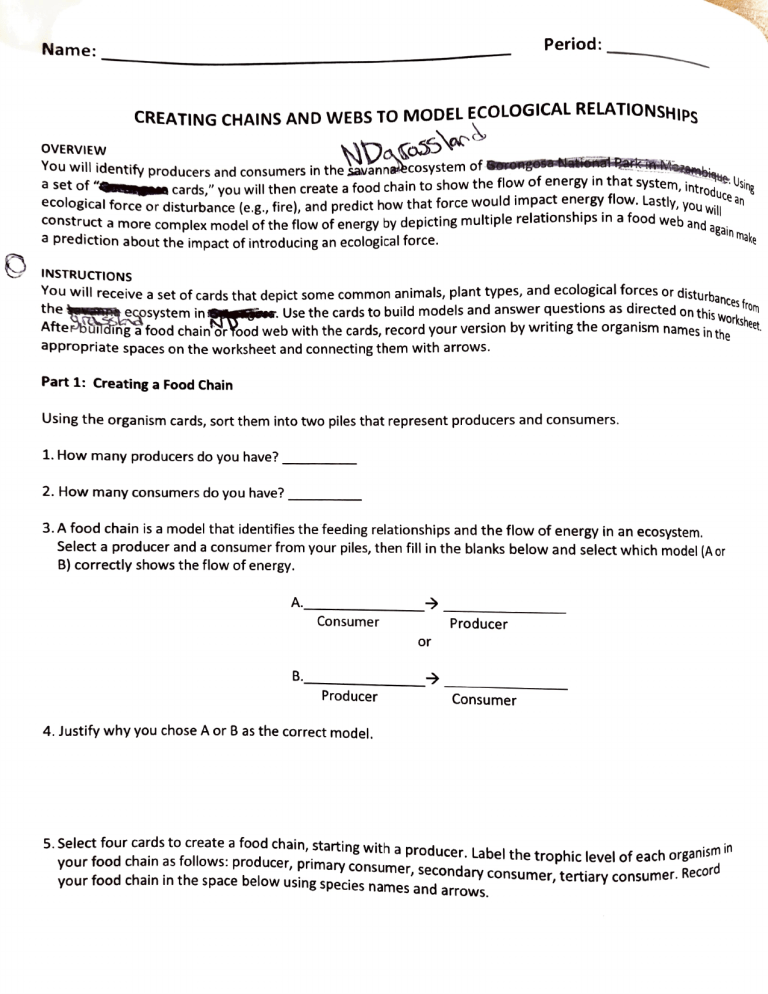
Period Name: CREATING CHAINS AND WEBS TO MODEL OVERVIEW a w set NDasossend laentify of " ECOLOGICAL RELATIONSHIDC onetParK zembiee t producers and consumers in the savannaecosystem of Sorongosar show the flow of energy in that system. tem, inte introduceUsin a cards," you will then create a food chain to ecological force or disturbance (eg., fire), and predict how that force would impactenergy tlow. Lastly, you will relationships in a food web and. nd again make ruct a more complex model of the flow of energy by depicting multiple a prediction about the impact of introducing an ecological force. INSTRUCTIONS You will receive a set of cards that depict some common animals, plant types, and ecological forces or disturbanres Use the cards to build models and answer questions as directed on thie.rom the . cosystem in workshe AftePbunding a food chain'orYood web with the cards, record your version by writing the organism names in thee appropriate spaces on the worksheet and connecting them with arrows. Part 1: Creating a Food Chain Using the organism cards, sort them into two piles that represent producers and consumers. 1. How many producers do you have? 2. How nmany consumers do you have?. 3.A food chain is a model that identifies the feeding relationships and the flow of energy in an ecosystem. Select a producer and a consumer from your piles, then fill in the blanks below and select which model (A or B) correctly shows the flow of energy. A. Consumer Producer or B. Producer Consumeer 4. Justify why you chose A or B as the correct model. 5.Select four cards to create a food chain, starting with a producer. Label the trophic level of each organils in your food chain as follows: producer, primary consumer, secondary consumer, tertiary consumer. Ke ord your food chain in the space below using species names and arrows. part 2: Available EnerEY at each Trophic Level small fraction of energy available at any trophic level is eransferred to the next trophic level. That fraction is Onlya .1% Tertiary Consumers stimated to be about 10 percent of the available energy. The other 90 percent of the energy is needed by organisms Secondaryy level for living, growing, and that reproducing. tha trophic Consumers olative 1 Amount of Availbe This relationsk is shown in the energy pyramid above. It ests that for any food chain, the primary producer 10% Primary cnhic level has the most energy and the top trophic level Consumers trop Ernogy has the least. 6. Why is a pyramid an fective model for quantifying 100% Producers energy flow? 7. Place the organisms from your original food chain on the pyramid provided. each trophic level and the the species names for record transfer, kilocalories of energy/area. 8. Using the rule of 10 percent in energy level had 3,500,000 producer if your energy available at that level o r two trophic levels. sentences, the describe how available energy may population sizes affect the amount oforganisms at of different
