GDP Growth Comparison: Pakistan vs. USA Homework
advertisement

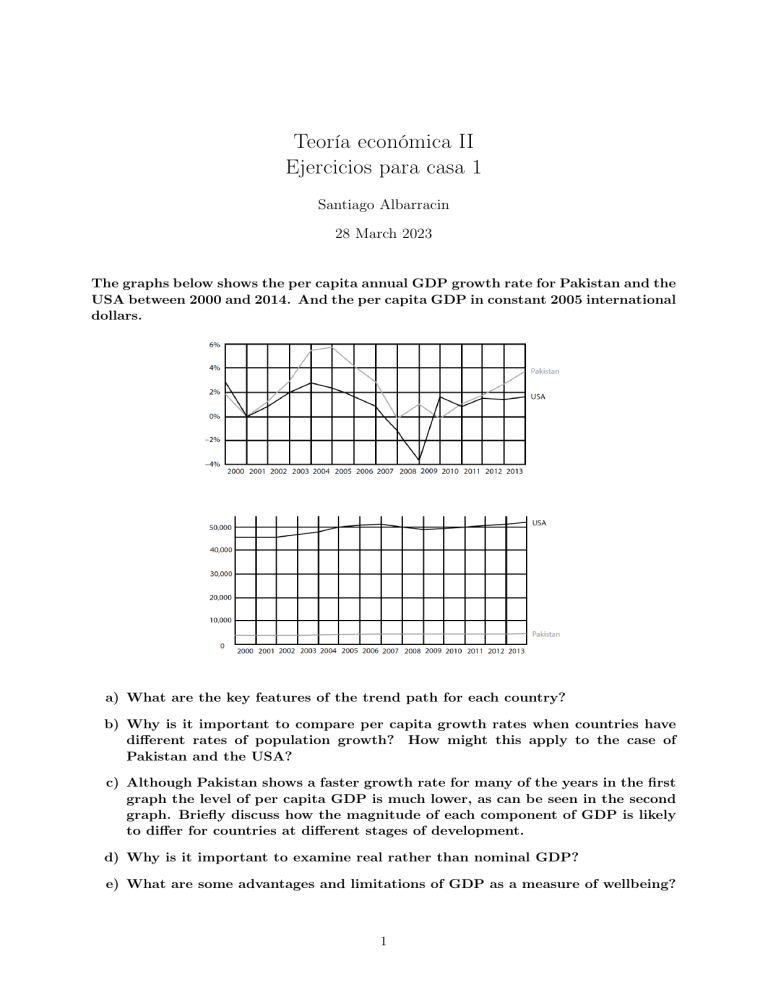
Teoría económica II Ejercicios para casa 1 Santiago Albarracin 28 March 2023 The graphs below shows the per capita annual GDP growth rate for Pakistan and the USA between 2000 and 2014. And the per capita GDP in constant 2005 international dollars. a) What are the key features of the trend path for each country? b) Why is it important to compare per capita growth rates when countries have different rates of population growth? How might this apply to the case of Pakistan and the USA? c) Although Pakistan shows a faster growth rate for many of the years in the first graph the level of per capita GDP is much lower, as can be seen in the second graph. Briefly discuss how the magnitude of each component of GDP is likely to differ for countries at different stages of development. d) Why is it important to examine real rather than nominal GDP? e) What are some advantages and limitations of GDP as a measure of wellbeing? 1


