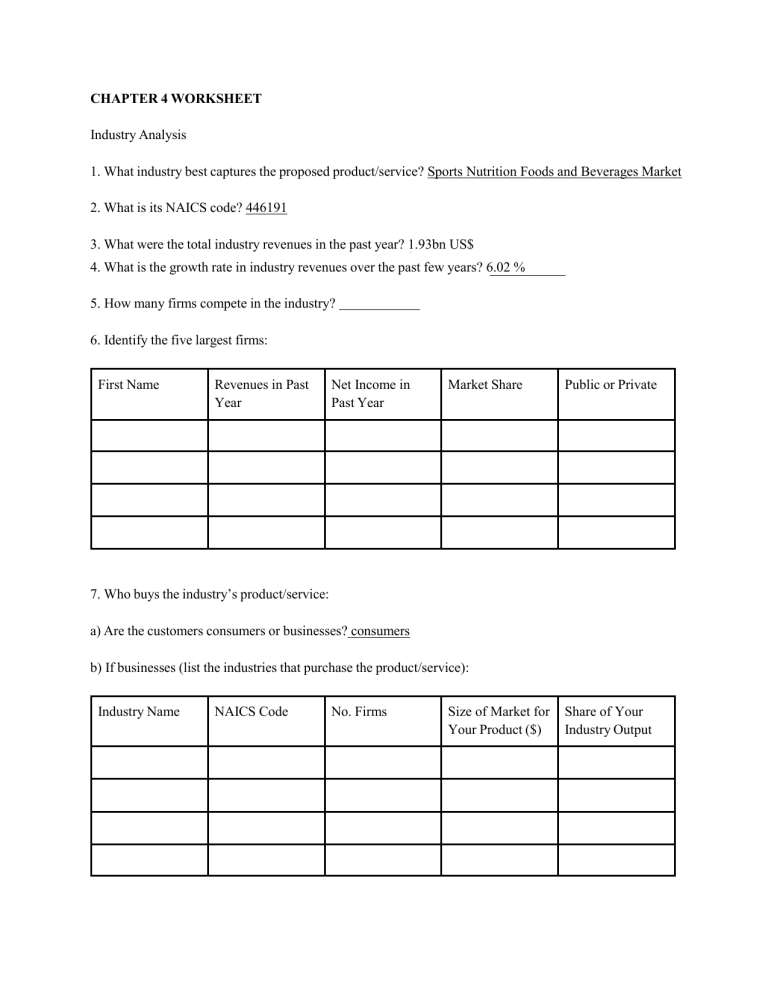
CHAPTER 4 WORKSHEET Industry Analysis 1. What industry best captures the proposed product/service? Sports Nutrition Foods and Beverages Market 2. What is its NAICS code? 446191 3. What were the total industry revenues in the past year? 1.93bn US$ 1.93 4. What is the growth rate in industry revenues over the past few years? 6.02 % 5. How many firms compete in the industry? 6. Identify the five largest firms: First Name Revenues in Past Year Net Income in Past Year Market Share Public or Private 7. Who buys the industry’s product/service: a) Are the customers consumers or businesses? consumers b) If businesses (list the industries that purchase the product/service): Industry Name NAICS Code No. Firms Size of Market for Your Product ($) Share of Your Industry Output c) If consumers (how do sales vary over demographic segments that purchase the product/service): Demographic Segment Size of Segment (People) Purchase of the Product ($/Person) Size of Market of Product ($) Share of Your Industry Output 8. Through what channels is the product sold to customers? Distribution Channel NAICS Code Stage in Channel* Number of Firms in Channel Markup of Channel Share of Your Industry Output *If this channel is the only intermediary between the primary industry and the customer, then stage = 1; if product passes through one earlier intermediary, then = 2. 9. Identify the main industry associations and journals Association/Journal Phone Number Membership/Circulatio n Main Objective(s) 10. What market research companies/analysts cover the industry? Company Means to Access Reports Key Observations on the Industry 11. Characterize the financials of firms in the industry: Focal Industry Distributor Customer 100% 100% 100% Income Statement Ratios Sales Cost of Goods Sold R&D Sales, General % Admin Net Income Operations Metrics Inventory Turns Performance Ratios Return on Fixed Assets Return on Equity The remaining information is obtained from industry articles: 12. Distribution of product price at final customer: Minimum: Maximum: Mean: Std Dev: Median: 13. What are the closest substitutes to your industry’s product/service: Substitute Average Price of Substitute Factors That Favor Substitute Over Focal Product 14. Are there any complements to your industry’s product/service: Complement Nature of Dependance Average Price How Mature Is Complement Industry 15. What are the main inputs to your industry’s product/service: Input Input’s Share of Your Price Unit Cost Number of Firms in Supply Industry Key Firms 16. Given all the above, what do you see as the main entry barriers to the industry? 17. Identify any trends, insights gained from your research that is not captured above. List source for each.” CHAPTER 5 WORKSHEET Perceptual Mapping 1. Identifying buyers (from secondary data) a) Are your customers consumers or businesses? b) If businesses (list the industries that purchase your product/service): Industry Name SIC Code No. Firms Size of Market for Your Product Share of Your Industry Output Size of Segment (People) Purchases of the Product ($/Person) Size of Market for Product ($) Share of Your Industry Output c) If consumers: Demographic segment 2. What mailing lists (or other sources) can you use to locate people/firms in your industry? Source Segment(s) Covered Extent of Coverage (% of People in Segment) Cost per Person 3. Are you conducting interviews or focus groups to gather data? Why? 4. Characterize the people you interviewed: Name Segment/Industry 5. What raw dimensions were elicited in the interviews: Raw Dimensions/Attribute Times Mentioned 6. What competing/substitute products were elicited? Raw Dimensions/Attribute Times Mentioned Source of Name 7. Summarize the rankings of each product on each dimension Product Dimensions 1 2 3 Price 4 5 8. Create Snake Diagram of above table: Ranking Dimensions 1 2 Legend for Products 9. Interesting comments from interviews/focus groups 10. Where is there opportunity in perceptual map? 3 4 5 11. What physical attributes of the product can you create to capture the perceptual dimensions elicited from the focus group/interviews: Perceptual Dimension Physical Attribute


