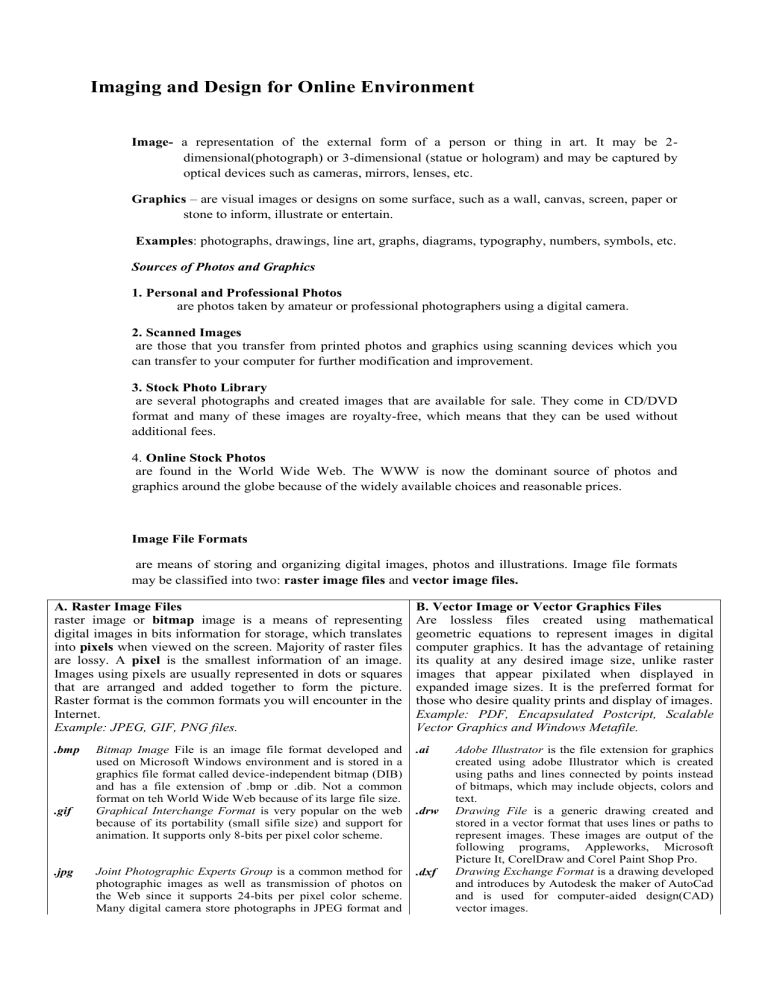
Imaging and Design for Online Environment Image- a representation of the external form of a person or thing in art. It may be 2dimensional(photograph) or 3-dimensional (statue or hologram) and may be captured by optical devices such as cameras, mirrors, lenses, etc. Graphics – are visual images or designs on some surface, such as a wall, canvas, screen, paper or stone to inform, illustrate or entertain. Examples: photographs, drawings, line art, graphs, diagrams, typography, numbers, symbols, etc. Sources of Photos and Graphics 1. Personal and Professional Photos are photos taken by amateur or professional photographers using a digital camera. 2. Scanned Images are those that you transfer from printed photos and graphics using scanning devices which you can transfer to your computer for further modification and improvement. 3. Stock Photo Library are several photographs and created images that are available for sale. They come in CD/DVD format and many of these images are royalty-free, which means that they can be used without additional fees. 4. Online Stock Photos are found in the World Wide Web. The WWW is now the dominant source of photos and graphics around the globe because of the widely available choices and reasonable prices. Image File Formats are means of storing and organizing digital images, photos and illustrations. Image file formats may be classified into two: raster image files and vector image files. A. Raster Image Files raster image or bitmap image is a means of representing digital images in bits information for storage, which translates into pixels when viewed on the screen. Majority of raster files are lossy. A pixel is the smallest information of an image. Images using pixels are usually represented in dots or squares that are arranged and added together to form the picture. Raster format is the common formats you will encounter in the Internet. Example: JPEG, GIF, PNG files. .bmp .gif .jpg B. Vector Image or Vector Graphics Files Are lossless files created using mathematical geometric equations to represent images in digital computer graphics. It has the advantage of retaining its quality at any desired image size, unlike raster images that appear pixilated when displayed in expanded image sizes. It is the preferred format for those who desire quality prints and display of images. Example: PDF, Encapsulated Postcript, Scalable Vector Graphics and Windows Metafile. Bitmap Image File is an image file format developed and used on Microsoft Windows environment and is stored in a graphics file format called device-independent bitmap (DIB) and has a file extension of .bmp or .dib. Not a common format on teh World Wide Web because of its large file size. Graphical Interchange Format is very popular on the web because of its portability (small sifile size) and support for animation. It supports only 8-bits per pixel color scheme. .ai Joint Photographic Experts Group is a common method for photographic images as well as transmission of photos on the Web since it supports 24-bits per pixel color scheme. Many digital camera store photographs in JPEG format and .dxf .drw Adobe Illustrator is the file extension for graphics created using adobe Illustrator which is created using paths and lines connected by points instead of bitmaps, which may include objects, colors and text. Drawing File is a generic drawing created and stored in a vector format that uses lines or paths to represent images. These images are output of the following programs, Appleworks, Microsoft Picture It, CorelDraw and Corel Paint Shop Pro. Drawing Exchange Format is a drawing developed and introduces by Autodesk the maker of AutoCad and is used for computer-aided design(CAD) vector images. .png .psd it’s not ideal for use in line art. Portable Network Graphic is a free, open-source bitmap image format to improve on GIF which has a small file but can handle more colors since it supports 24-bit per pixel color scheme and supports true employs a lossless compression, meaning it does not lose the quality of the image despite successive editing. Photoshop Document is a native file format for Adobe Photoshop, and since many are using this program to create images, it is very popular. Photoshop has the ability to read all of the above formats and edit them. .ps PostScript is a page description language (PDL) developed by Adobe, basically a language for printing documents on laser printers and image setters(high resolution printers) used to produce camera ready copies. .svg Scalable Vector Graphics(SVG) is the most common vector graphic format on the internet; It was developed by The World Wide Web Consortium (W3C) to display vector graphics. It is an open format and can be opened by Adobe, Corel and open graphics programs. Other File Formats include TIFF(Tagged Image File Format), RAW (Raw Image Format), GIF (Graphics Interchange Format), and the PSD(Photoshop Document). Basic Principles of Graphics and Layout Layout – is part of graphic design that deals in the arrangement of visual elements on a page. A good layout should have a balanced make up and alignment of elements. Balance- it is the visual weigh of objects, texture, colors, and space is evenly distributed on the screen. Symmetrical - a layout where there are equal weight of elements on both sides of the page. Asymmetrical - a layout where there is an artistic and different intensity on one side of the page. Emphasis – an area in the design that may appear different in size, texture, shape or color to attract the viewer’s attention. There should be one point of interest in a page. Movement – how the eye moves through the composition leading the attention of the viewer from one aspect to another. Pattern, Repetition, and Rhythm – these are the repeating visual element on an image or layout to create unity in the layout or image. Rhythm is achieved when visual elements create a sense of organized movement. Proportion – visual elements create a sense of unity where they relate well with one another. Variety – this uses several design elements to draw a viewer’s attention. Examples Balance Variety Emphasis Movement Pattern Repetition Rhythm Proportion Infographics (Information graphics) are used to represent information, statistical data, or knowledge in a graphical manner usually done in a creative way to attract the viewer’s attention. Infographics make complex data become more visually appealing to an average user. An effective infographic grabs your attention and keeps it just long enough to deliver an important message or teach you important information. Principles in Creating Infographics 1. Be Unique - make it engaging and memorable with unique twist on something that everyone can relate to and can capture the audiences’ attention. 2. Be Simple - don’t throw in so much detail and extraneous information, people will probably going to turn away or click somewhere else because it looks too complicated to be worth their time. 3. Be Creative and Bold it’s important to make sure that your main message is bold and obvious. It is your key to grabbing attention quickly and getting your message across with effective info-graphics. 4. Less is More keeping your text minimal will most likely produce more impact than a page full of words. The goal is to entice audience to stop scrolling and look at your info-graphic.An effective image will grab the attention of the audience with something as simple as an effectively displayed word that makes them stop and read the important information. 5. The fortunate is in the forwarding most important thing you want from an effective infographic is a simple way to people to share it with their friends. Be sure to include links reminding people that they want their friends to enjoy the information they have just found. Creating Infographics using Piktochart 1. Create a Piktochart account by going to www.piktochart.com and click sign up on the upper right corner of the page. 2. Fill up the information form; alternatively, you can connect with Google+ or Facebook. 3. Once you have created an account and logged in, select a template for your infographic. Since your data relates to marketing or sales, simply hover over the Presenta Board theme under Free Themes then select Create. 4. The Piktochart editor will open. The Presenta Board theme consists of three blocks(parts). Select the blocks and input the information as you see fit. 5. While editing a block, you can use the various tools on the left side of the page: Graphics - allows you to insert lines, shapes, icons, and even photos. Uploads - allows uploading images Background- allows changing the background of a selected block Text- allows inserting text with the option to add text frames Styles-allows modifying the color scheme Tools- allows to create charts (similar to PowerPoint), maps, and videos. 6. Save your work, click on Save. To save it in your computer click Download. Principles of Basic Techniques of Image Manipulation Most of the time, we just capture an image and upload it on our Facebook account and let it does the rest by formatting our image to best fit the standards set by Facebook. Personal website do not necessarily have to downsize the file size, but if you have a wider target audience, you need to make the necessary changes. Here are some tips to help you edit images for your website. 1. Choose the right file format.Try to make a real-life photograph into GIF to see the difference between PNG, GIF, and JPEG. Knowing the purpose is the key to finding out the best file format. 2. Choose the right image size.A camera with 12 megapixels constitutes to a bigger image size. Monitors have a resolution limit, so even if you have a million megapixels, it will not display everything. 3. Caption it. Remember to put a caption on images whenever possible. If it is not related to the web page, then remove it.
