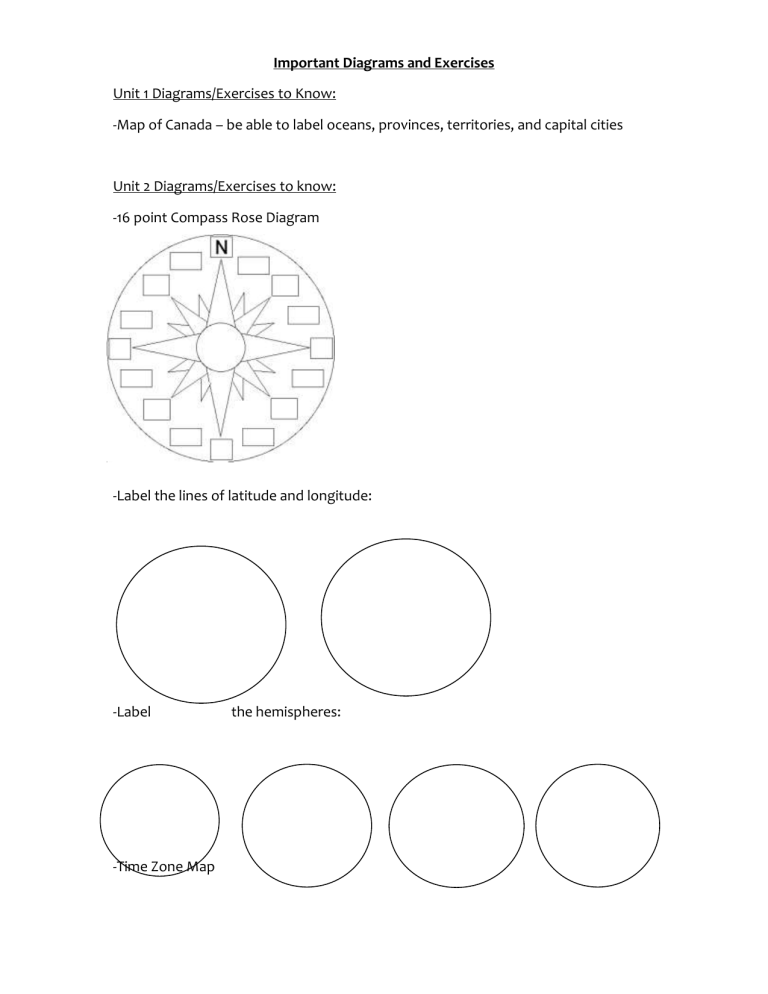
Important Diagrams and Exercises Unit 1 Diagrams/Exercises to Know: -Map of Canada – be able to label oceans, provinces, territories, and capital cities Unit 2 Diagrams/Exercises to know: -16 point Compass Rose Diagram -Label the lines of latitude and longitude: -Label -Time Zone Map the hemispheres: What time is it? a. It is _______ in Vancouver when it is 12 noon in Ottawa. b. It is _______ in Vancouver when it is 9 AM in Ottawa. c. It is 9 AM in Vancouver when it is _______ in Ottawa. d. It is 3 PM in Vancouver when it is _______ in Ottawa. e. It is midnight in Vancouver when it is _______ in Ottawa. f. In Toronto, it is 8 AM when it is _______ in Vancouver. g. In Winnipeg, it is _______ when it is 6 AM in Vancouver. h. In Halifax, it is 10 PM when it is _______ in Montreal. i. In Edmonton, it is _______ when it is 4:30 PM in Calgary. j. In St John’s (Newfoundland and Labrador), it is 10:30 AM when it is _______ in Québec (the city). Area (Small or large?) Large Scale Maps Small Scale Maps a) Locate the equator on the grid. b) Locate the Prime Meridian on the grid. c) Place the letter A at 20º N, 50º W d) Place the letter B at 50º S, 75º E e) Place the letter C at 0º , 30º W Detail (A lot of a little?) Example (what type of map?) Unit 3 Diagrams/Exercises to know: -Layers of the Earth: -Rock Cycle -Plate Tectonics Draw the diagram for the word in the box given. Type of Movement Convergence 3 typess: Divergence 2 types: Sliding/Transform TWO positive effects and TWO negative effects of a volcanic eruption: Positive Negative -Climate Graph CANADA - OTTAWA J F M A M J J A S O N D TEMP. (˚C) -18 -9 -5 5 15 19 22 20 17 8 3 -7 PRECIP. (mm) 70 65 73 74 79 91 91 88 90 81 80 82 Make a climate graph for Ottawa based on the information on the page: Climate Graph For: ___________________ Unit 4 Diagrams/Exercises to know: Canada's population by age group and sex, 2006 Census of Population Age group % males % females 0 to 4 years 2.7 2.6 5 to 9 years 2.9 2.8 10 to 14 years 3.4 3.2 15 to 19 years 3.5 3.3 20 to 24 years 3.3 3.3 25 to 29 years 3.1 3.2 30 to 34 years 3.1 3.3 35 to 39 years 3.4 3.6 40 to 44 years 4.1 4.2 45 to 49 years 4.1 4.2 50 to 54 years 3.7 3.8 55 to 59 years 3.2 3.3 60 to 64 years 2.5 2.6 65 to 69 years 1.9 2.0 70 to 74 years 1.6 1.8 75 to 79 years 1.2 1.6 - Practice doing a Population Pyramid with information from the table below: 0.8 1.3 85 years and 0.5 over 1.1 80 to 84 years Do the calculations below: Remember! Birth Rate= (BPY/Total Pop) x 1000 Death Rate= (DPY/Total Pop) x 1000 Imm. Rate= (IPY/Total Pop)x1000 Em Rate= (EPY/Total Pop)x1000 Nat Increase Rate= BR-DR Net Mig Rate= Imm Rate-Em Rate Place Total Births per Population year BIRTH RATE Deaths per DEATH Natural year RATE Increase Rate Country X 16 000 000 175 000 90 000 Country Y 23,043,841 120 000 180 000 Place Total Immigrants Immigration Emigrants EMIGR- Net Population per year RATE per year ATION Migration RATE Rate Country X 10 000 000 6000 100 000 Country Y 8 567 000 150 000 14 000 16. Find the population density of the following countries: Country Population Area Afghanistan 29,835,392 250,000 Albania 2,994,667 11,100 Problems with high population density Population Density Problems with low population density


