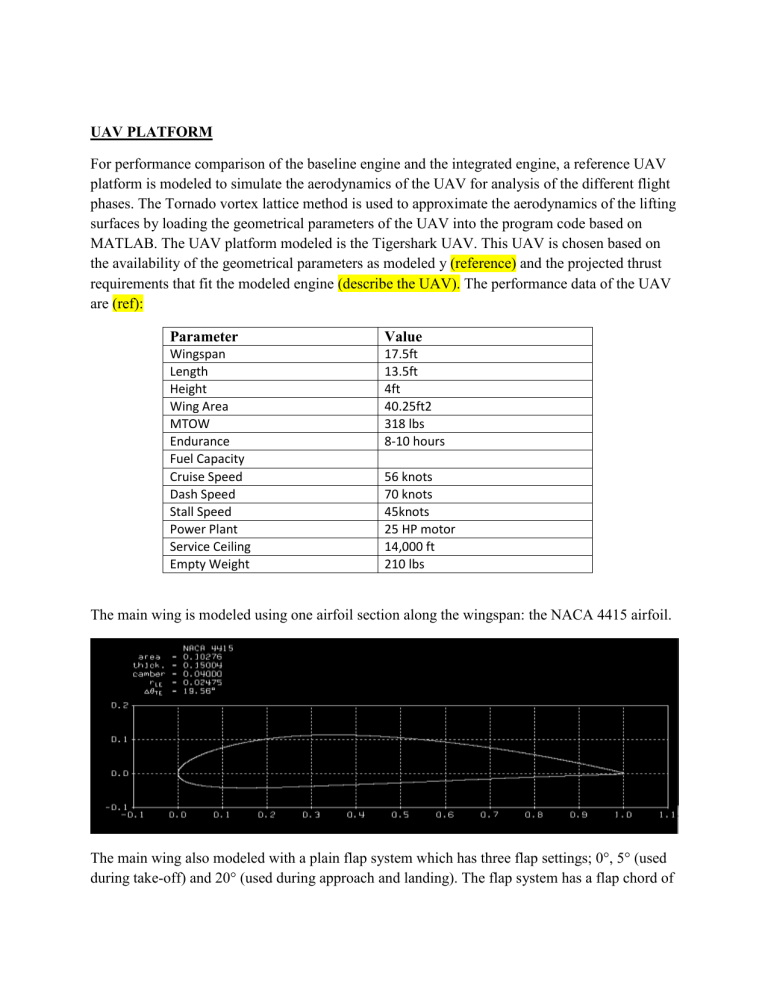
UAV PLATFORM For performance comparison of the baseline engine and the integrated engine, a reference UAV platform is modeled to simulate the aerodynamics of the UAV for analysis of the different flight phases. The Tornado vortex lattice method is used to approximate the aerodynamics of the lifting surfaces by loading the geometrical parameters of the UAV into the program code based on MATLAB. The UAV platform modeled is the Tigershark UAV. This UAV is chosen based on the availability of the geometrical parameters as modeled y (reference) and the projected thrust requirements that fit the modeled engine (describe the UAV). The performance data of the UAV are (ref): Parameter Value Wingspan Length Height Wing Area MTOW Endurance Fuel Capacity Cruise Speed Dash Speed Stall Speed Power Plant Service Ceiling Empty Weight 17.5ft 13.5ft 4ft 40.25ft2 318 lbs 8-10 hours 56 knots 70 knots 45knots 25 HP motor 14,000 ft 210 lbs The main wing is modeled using one airfoil section along the wingspan: the NACA 4415 airfoil. The main wing also modeled with a plain flap system which has three flap settings; 0°, 5° (used during take-off) and 20° (used during approach and landing). The flap system has a flap chord of 21% of the local wing chord. The wing is modeled as a rectangular section with no twist or taper. The outer section of the wing houses the ailerons used for maneuvering. These ailerons are however not modeled since the analysis assumes flight in a vertical plane thus no rolling or yawing motions are considered. The horizontal and vertical stabilizers are modeled as having the standard NACA 0012 airfoil section. The center of gravity of the UAV is taken to be on the symmetry line at 33% of the chord line. Mission profile definition The mission profile gives a typical example mission that the UAV will have to perform as a case study for performance comparison. It is used to assess the difference between a baseline micro gas turbine engine and integrated micro gas turbine in terms of flight performance to draw conclusions on the performance improvement brought by the Inverted Brayton Cycle engine as an exhaust heat energy recovery system. The mission profile consists of the following seven phases: Take-off. Climb. Cruise. Descent. Loiter. Approach. Landing. The UAV takes off with maximum power (restricted to a time of five minutes due to high thermal and mechanical stresses at this engine throttle setting) until it reaches the screen height and fulfills the user-specified take-off time, which cannot exceed the maximum operating conditions of the engine. Take-off has a ground run and airborne phase to clear obstacle of height usually equivalent to 50ft (15m). During the climb phase the engine is throttled back to the maximum continuous engine setting. Once the UAV reaches the cruising altitude of 14,000ft, defined for the reference UAV platform, the engine setting is such that drag equals thrust and level flight can be maintained. Next, the UAV enters the descent phase until the altitude is reduces to 3,000ft. A loiter maneuver is performed at this altitude followed by an approach phase. During the approach phase the UAV first descents towards 1,000ft where it flies level to intersect the ILS, to initiate the final descent phase. The landing phase starts as soon as the UAV reaches the screen height (50ft). The landing phase has an airborne and ground run phase. The mission is concluded once the UAV has come to a complete stop on the runway. Assumptions In developing this case study, several assumptions are made to simplify the calculations though with a decreased accuracy of the results. However, since the study is an initial exploration and comparison of performance of the two engines, detailed models and high accuracy results are not yet desired. The inaccuracies in modeling the performance cuts across the two engine models and thus the conclusions drawn are still dependable. The following assumptions are made during the performance analysis: The UAV flight is in the vertical plane thus the yawing and rolling motions are not considered. Only pitching and level flight in the vertical plane is considered. The UAV model is assumed to be a rigid point mass body. The forces that lead to the translational motion are therefore considered acting on the center of gravity of the body. The bending of the fuselage and wings due to the aerodynamic forces are not considered. The wind effects are not included in the model. This does not affect the comparison of the engine types. Fuel is stored inside the fuselage. The center of gravity is assumed to be located on the lateral symmetry axis at 33% of the mean aerodynamic chord. This does not affect the results since no control and stability analysis is done. The lift coefficient is calculated assuming incompressible, inviscid irrotational flow (Tornado method). The drag coefficient is obtained using the drag polar equation approximation with the zero-lift drag coefficient obtained empirically using the component build up technique. This method is based on the thin plate approximation. This assumption will create an aerodynamic model with acceptable accuracy for this study. Flight performance simulation. A flight performance program is developed to numerically simulate the flight performance of the baseline UAV with the two engines. The program follows the various mission segments chronologically. The flight performance simulation generates the following output to determine the mission performance: Total and mission segment endurance and range. The thrust Fuel consumption Lift and drag forces and coefficients. The flight performance simulation is split into the following sections: Aerodynamic properties analysis Propulsion analysis Mission phase analysis Total mission analysis Aerodynamic properties An aircraft performance analysis requires the lift and drags forces to be calculated and thus the lift and drag coefficients at different angles of attack, altitudes, velocities and aircraft configurations (control surface settings and the landing gear). Some of the methods that can e used to model the aerodynamic characteristics of the aircraft include: i. ii. iii. iv. Empirical relations. Vortex Lattice Method (VLM) Euler equations. Navier-Stokes equations (computational fluid dynamics analysis). For this case study, a combination of the empirical relations and Vortex Lattice Method is used. Empirical relations are used for zero lift drag coefficient estimation while the VLM is used to model the lifting surfaces giving the lift coefficient for a case of incompressible inviscid flow. These methods yield acceptable model parameters with small computation power and time. VLM is important in the initial design phase of the aircraft, giving reasonable approximations of the aerodynamic characteristics. VLM is an extended model of Prandtl’s classical lifting line theory. A number of lifting panels are placed on the lifting surfaces, each containing a single horseshoe vortex. The entire wing is covered by a lattice of horseshoe vortices, each having a different unknown strength. A control point is placed on each panel. One can calculate the normal velocity induced by all vortices using the Biot-Savart law at any control point. A set of algebraic equations can be created by applying the flow-tangency condition at all control points. This set of equations can be solved for all the unknown strength in order to calculate the lift and drag coefficients. Some disadvantages of using VLM is that it can only be used for incompressible and inviscid flows, since it is built on the potential flow which neglects viscous effects. The empirical relations are therefore necessary since VLM cannot estimate the viscous drag of a model. This results in a less accurate determination of the aerodynamic characteristics. Several VLM software packages are available (Athena Vortex Lattice, Tornado, Vlaero+ etc.). The Tornado software package is selected based on its ease of use, relative small learning curve and availability. Tornado is available freely under a GNU general public license. The total drag coefficient is determined using the drag polar equation which has three components; the zero-lift drag/parasite drag coefficient (CD0), the lift dependent/lift induced drag coefficient (CDi)and the wave drag (CDw). CD = CD0 + CDi + CDw = CD0 + k*CL2 +CDw Where k = 1 π∗AR∗e And e is the Oswald efficiency factor that is obtained empirically, AR is the aspect ratio. The airspeed of the UAV is however below Mach 0.3 where the compressibility effects sets in; the UAV therefore operates in the subsonic flow regime and the wave drag component is therefore negligible. The Tornado VLM program is used to determine the lift coefficient while empirical relations are used to determine the parasite/zero-lift drag coefficient. The drag and lift coefficient depend on the UAV configuration changes caused by flap settings and the landing gear configuration. The take-off setting has an absolute flap deflection angle of 5 degrees and the landing setting has a flap deflection of 20 degrees. The cruise setting is taken as a flap deflection of 0 degrees. The landing gear of the UAV is non-retractable and thus the contribution to the total drag coefficient is the same for all the flight phases. Lift coefficient The lift coefficient is modeled in Tornado y defining the lifting surfaces of the UAV which include the main wing, the horizontal tail and two vertical tails. The flap settings are also modeled in order to provide the lift coefficient at different flap settings for the different flight phases. The results of the Tornado modeling are the CL-alpha graphs for each flap setting. The Tornado geometry input for lift coefficient calculation Zero-lift drag coefficient The zero-lift drag coefficient is estimated using the component build-up technique which relies on empirical relations for each component. Each external component (wing, horizontal & vertical tail, fuselage, tail booms, flaps, landing gear and miscellaneous items) of the UAV has a certain drag contribution which needs to be taken into account to estimate the total zero-lift drag coefficient. The wing, fuselage, tail booms and horizontal & vertical tail zerolift coefficients are calculated using the thin plate approximation. This approximation assumes that each component is modeled as a thin flat plate with a certain skin friction coefficient, Cf. A form factor (𝐹𝐹) is also introduced to compensates for the actual shape of the component, accounting for super velocities and pressure drag resulting from the component shape. An interference factor (𝑄) is also taken into account to represent the interference between the various components. The wetted area of the component represents the total area of the component totally submerged in the flow. A reference area usually taken as the wing planform area is also required in the calculation of the zero-lift drag. It is a measure of the relative size of each component compared to other components. The equation for calculating the zero-lift drag coefficient of each component is given below; CD0 = Cf∗FF∗Q∗Swet Sref The skin friction depends on the boundary layer conditions. The airflow over a thin plate as used to approximate the coefficients always start with laminar flow at the leading edge. At some point downstream, transition to turbulent flow occurs. This transition point can be calculated by dividing the critical Reynolds number (Recr = 500,000) y the Reynolds number of the component (Recomp). The component Reynolds number is calculated using the equation; Recomp = ρ∗Veff∗lcomp μ The transition point is; (x/c)trans = Recr Recomp The laminar flow skin friction coefficient is calculated using the equation; Cflam = 1.328 √Recomp The turbulent flow skin friction coefficient is approximated as; Cfturb = 0.074 𝑅𝑒𝑐𝑜𝑚𝑝^0.2 The total skin friction coefficient is; Cf = (x/c)trans*Cflam +Cfturb - (x/c)trans*Cfturb Form factors Aerodynamic analysis results The lift coefficient The lift coefficients obtained from the Tornado for different flap settings are plotted as the CLAOA graphs. The maximum lift coefficient for each flap setting is determined using the XFOIL program for the given lifting surface airfoil.
