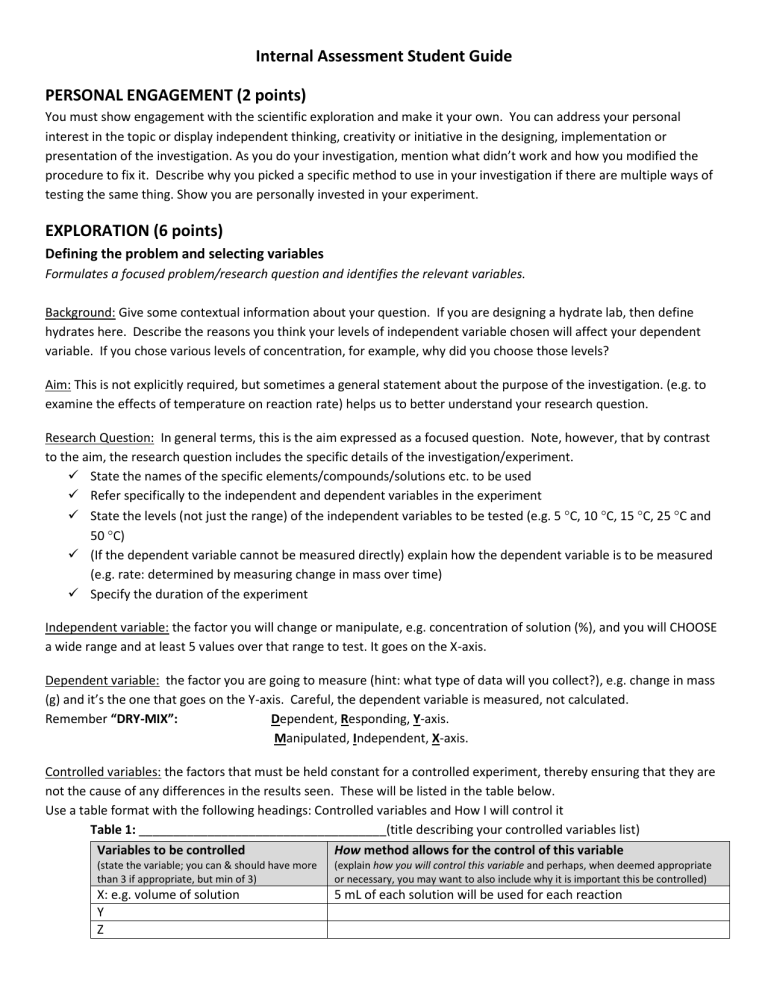
Internal Assessment Student Guide PERSONAL ENGAGEMENT (2 points) You must show engagement with the scientific exploration and make it your own. You can address your personal interest in the topic or display independent thinking, creativity or initiative in the designing, implementation or presentation of the investigation. As you do your investigation, mention what didn’t work and how you modified the procedure to fix it. Describe why you picked a specific method to use in your investigation if there are multiple ways of testing the same thing. Show you are personally invested in your experiment. EXPLORATION (6 points) Defining the problem and selecting variables Formulates a focused problem/research question and identifies the relevant variables. Background: Give some contextual information about your question. If you are designing a hydrate lab, then define hydrates here. Describe the reasons you think your levels of independent variable chosen will affect your dependent variable. If you chose various levels of concentration, for example, why did you choose those levels? Aim: This is not explicitly required, but sometimes a general statement about the purpose of the investigation. (e.g. to examine the effects of temperature on reaction rate) helps us to better understand your research question. Research Question: In general terms, this is the aim expressed as a focused question. Note, however, that by contrast to the aim, the research question includes the specific details of the investigation/experiment. State the names of the specific elements/compounds/solutions etc. to be used Refer specifically to the independent and dependent variables in the experiment State the levels (not just the range) of the independent variables to be tested (e.g. 5 C, 10 C, 15 C, 25 C and 50 C) (If the dependent variable cannot be measured directly) explain how the dependent variable is to be measured (e.g. rate: determined by measuring change in mass over time) Specify the duration of the experiment Independent variable: the factor you will change or manipulate, e.g. concentration of solution (%), and you will CHOOSE a wide range and at least 5 values over that range to test. It goes on the X-axis. Dependent variable: the factor you are going to measure (hint: what type of data will you collect?), e.g. change in mass (g) and it’s the one that goes on the Y-axis. Careful, the dependent variable is measured, not calculated. Remember “DRY-MIX”: Dependent, Responding, Y-axis. Manipulated, Independent, X-axis. Controlled variables: the factors that must be held constant for a controlled experiment, thereby ensuring that they are not the cause of any differences in the results seen. These will be listed in the table below. Use a table format with the following headings: Controlled variables and How I will control it Table 1: ____________________________________(title describing your controlled variables list) Variables to be controlled How method allows for the control of this variable (state the variable; you can & should have more than 3 if appropriate, but min of 3) (explain how you will control this variable and perhaps, when deemed appropriate or necessary, you may want to also include why it is important this be controlled) X: e.g. volume of solution Y Z 5 mL of each solution will be used for each reaction By using a table, it ensures that you have both identified the relevant variables (minimum of 3) and stated how you will control each one of them. (e.g. if testing pH, use buffers of given values to calibrate your instruments, etc.) When testing how concentration affects reaction rate, specify how you will keep the temperature constant (use a water bath at a specified temperatures or perform all trials within one period in our climate controlled classroom, etc.). It is important to note the difference in semantics between “air temperature” and “reaction temperature.” It is clearly more important to control reaction temperature than air temperature, so work to ensure that your language is precise. It is also important that you focus on the most significant variables that need to be controlled. You will not earn full credit if you focus on seemingly insignificant controls, while ignoring the major variables in need of control. Additionally, your best score will be penalized if you mention something that reveals an incorrect understanding of the experiment (trying to control a variable that would not affect your experiment whatsoever, for example). Developing a method for collection of data Develops a method that allows for the collection of sufficient relevant data. Equipment and materials: bulleted and alphabetized list of equipment and materials needed, including quantity and size of each (e.g. beakers (5), each 250 mL) Set-up: it is good to include a sketch (with labels, informative title and figure #) of any lab equipment that must be set up. Your entire report must be digital, that includes the set up so either draw by hand and scan, take a picture, or draw using Word or another program. Method: Detailed procedure. Should be written as a series of numbered steps that anyone could follow by simply reading these instructions. Include a sketch of your experimental setup (with labels, figure # and informative title). Your procedure must allow for the collection of sufficient relevant data. Once you have planned to investigate over an appropriate range with a minimum of 5 values (levels of independent variable), you should then specify in your method that you will repeat your experiment so that you have a minimum of three trials (more is better) for each value within the range so that a mean can be calculated. Be sure to include safety, environmental, and ethical concerns when appropriate. It is also a good idea to include specifications for clean up. ANALYSIS (6 points) Recording raw data Records appropriate quantitative and associated qualitative raw data, including units and uncertainties where relevant. Organize raw data into table(s) with Table #(s) and title(s) at the top. When you design your table of results, the independent variable typically goes in the left hand column, and the dependent variable goes in the right hand column (Don't forget to include units/uncertainties). General tips regarding the recording of raw data (numbers collected straight from experiment) Read experiment carefully and understand the ultimate goal. Before starting the experiment take time to design data table in a way that is logical and easy to follow. Data tables must have the following : o An appropriately descriptive title (written as Table 1: __________). o o o o o o o Note that tables are numbered independently from figures (e.g. Table 1: ___; Fig. 1:____; Fig. 2:____; Fig. 3:____ and then Table 2:___). While figures (graphs, pictures, setup diagrams, etc.) are labeled/titled underneath, table titles are placed above the table. Detailed and unambiguous column headings (e.g. volume of 1.00 M NaOH used in mL, ±0.1 mL) Units / Uncertainties Measurement matching uncertainties (decimal places) While not technically required, it is often a good idea to separate raw data from processed, or calculated, data. Any measurement that was made and recorded during the experiment should show up in the raw data (e.g. in a hydrate lab you can’t just subtract out the mass of the dish from all your masses; you need to show the actual readings from the balance. Additionally, in this lab you can’t just list your initial and final/constant masses; you must list all those measured, such as mass after 1st heating, mass after 2nd heating, etc.) What are uncertainties and why must I take them into account? Uncertainties are a range of acceptable measurements that account for errors due to the increments of the instrument of measure itself. For example: o When you take a centimeter ruler, you notice that the smallest increment is 1 mm or 0.1 cm. o Most people can agree that you can at least read 0.5 mm or 0.05 cm on this ruler. o Therefore, this ruler has an uncertainty of +/- 0.05 cm. Thus values should be recorded to the hundredths place (precision of numbers should match level of uncertainty) These must be taken into account because all instruments of measure have increments. The smaller the increment, the more precise (and accurate) the reading. For example: o If you measured 100 mL of liquid in a 100 mL graduated cylinder and a 100mL beaker, you would find the graduated cylinder is much more precise. o Why? The increments on a 100 mL graduated cylinder are much smaller and therefore much more exact than a 100 mL beaker. Therefore, the graduated cylinder has a smaller uncertainty value. Making this instrument of measure more precise for measuring volume. In addition to quantitative data, you must also record qualitative data. Any observable data that enhances the quality of the data itself and is aligned with the purpose of the experiment should be included. For example: Experiment that involves color, precipitate, texture, size and or odor change can be included. If needed, a legend of what these changes indicates (controls) can also be helpful. Processing raw data Processes the quantitative data correctly Data Processing (raw data converted into something usable in order to answer your question) can be shown in several ways: a) On a separate data table or with the data collection. This depends on the volume of data / data processing / space availability on paper. b) The appropriate numbers and calculations (including correct propagation of uncertainty). c) Selecting appropriate graphs (scatter plot or bar), charts, with the appropriate variables in mind. (ex: you can use a graph to process raw numbers into something such as a rate). Choosing the appropriate type of trend line (if any) and correctly assessing whether or not (0,0) is a valid point, whether or not it is appropriate to have the graph cross the y-axis, etc. Make sure you add lots of clear annotations to your graph to show the reader how you used it for processing. Presenting processed data Presents processed data appropriately and, where relevant, includes errors and uncertainties Guidelines to presenting data processing: Processing data in tables: o In data table format with complete title o The formula of what is being calculated should be shown, and units given in the top appropriate column of the table. o Uncertainties and errors included if calculations require it. o Significant figures during calculations Calculations o Only need to show full calculation for one trial as long as calculated results for other trials are summarized in a table. For the calculations you show, indicate that they are “sample calculations from trial 1,” for example. o Each calculation should first include a written description of what is being calculated, followed perhaps by a formula, then by plugging in numbers, then calculating result (carrying and propagating error continuously throughout to the extent possible). o Numbers should always be rounded to the correct number of sig figs (even though you carry them through in your calculator until the end when you round). If you wish to carry an extra digit through your shown calculations, you should state that you are doing this to be clear and then round at the end. o Uncertainties should have only one significant figure, as that is how they were originally recorded in the raw data. Graphs / Charts: o Appropriate Title (guide: Relationship between ….. or Y vs. X) o Should not be too big or too small. Appropriate scale on X and Y access, units included o Plotting done using dots with error bars if appropriate. o Line or curve of best fit when appropriate o Error bars included depending on sample size o Lots of annotations to make it clear how you used the graph to process your data Showing understanding of errors and uncertainties: o All measurements have uncertainties o In data collection you can show this by showing +/- sign with the uncertainty of the instrument of measure. o Make sure that you maintain the correct significant figures as with your uncertainties in your data collection and processing. o Statistical analysis can show trends. With these trends you can show percent errors or standard deviations from the expected results. Here is a helpful checklist for your Analysis. In my lab report, I have… Included all the raw data Included uncertainties on all measured variables Included all units and ensured units of measurement and uncertainties are the same Used consistent decimal places in each column of data Displayed my data in a table Included titles for my tables that describe their contents Organized my table in a way that is easy to read Calculated averages, reaction rates, and % changes where necessary Displayed my processed data in an organized table, complete with title and units Ensured that my significant figures are no greater than the lowest number of significant figure in the raw data used to in the processing of that data (see additional sheet on Dealing with Uncertainties in Biology) Included sample calculations below the table Calculated any percentage errors (compared to published values, that have been cited) that are required Graphed my PROCESSED data if it is appropriate to do so (only graph raw data if using that graph for processing) Chosen the correct type of graph (scatter plot, bar, histogram, etc.) Put error bars on the graph that represent either max/min values or +/- standard deviation if there are enough samples per condition (usually a minimum of 5) Ensured my graph has a title, axis labels (with units), and scales that are appropriate Drawn a line of best fit where appropriate EVALUATION (6 points) Concluding States a conclusion, with justification, based on a reasonable interpretation of the data. Restate the research question. To justify and explain your conclusion, briefly describe how and why the steps in your method led you to this conclusion. Make a clear statement of conclusion, summarizing your results (relating back to the aim & research question), including uncertainties. Comment on the consistency (precision) of your results. How did data compare from one trial to the next? Were there any outliers? Comment on the accuracy of your data. Compare experimental results with literature or textbook values (do research and & full reference citations) o Determine whether or not the accepted value lies within the range of your result (including uncertainty). If YES, perhaps much of your error can be attributed to random error associated with the uncertainty of your instruments. OR, perhaps there were systematic errors present that threw your data off in opposite directions, thus canceling each other out. If NO, then there must have been systematic errors present in addition to the random error associated with the uncertainty of measurement that must be considered. Evaluating Procedure(s) Evaluates weaknesses and limitations. Discuss the KEY limitations, weaknesses, or errors are identified and discussed o Evaluate the PROCEDURE, so there is an assumption that you followed the method as outline and yet there are still sources of error present. Therefore, do not include things like, “we may have miscalculated something.” Design and method must be commented upon as well as the quality of the data o Comments about precision and accuracy are relevant here o Each limitation should be described very specifically. “Human error” is not descriptive. Provided a detailed description of the limitation, as well as a specific explanation of how that limitation would affect your final result. e.g. if heat loss due to lack of a lid on your calorimeter is a source of error, explain how that would affect your final RESULT, perhaps heat of reaction (if heat was lost to the surroundings during the experiment then the final temperature would be artificially low, making the change in temperature artificially low, and then when substituted into q=mc∆T, the value for heat of reaction would in turn be made systematically lower.) o If the value of your result was too high, you should focus on systematic errors that would have this end result. If you focus on things that would result in making the value too low, then you have missed the mark. o Remember that you want to discuss the KEY limitations, so do not focus on minutia. o There are generally at least three limitations that should be discussed, but in some instances two could lead to a score of complete if they are discussed at great length. o If uncertainty (random error from equipment) is discussed here, be sure to focus on those measurements which yielded the highest % uncertainty. Improving the investigation Suggests realistic improvements in respect of identified weaknesses and limitations. For each limitation discussed for aspect two, describe at least one SPECIFIC and REALISTIC suggestion for minimizing or eliminating this source of error. Statements like, “we’ll be more careful” or “use equipment that is more precise” or “do more trials” or “hold temperature constant” are not helpful, nor would it be realistic to say something like, “next time, use an electronic balance that measures to the nearest ten-thousandth of a gram” or “do this in a humidity controlled room.” COMMUNICATION (4 points) This section is looking at the presentation and clarity of your lab report. See Presenting Processed Data section above Background section effectively communicates the chemistry behinds the experiment All sources are correctly cited using correct formal in both the report and in a Works Cited section The entire paper is clear, well-structured and easy to follow. Reread this Guide and make sure you have done IT ALL!
