Ctenophore Evolution: Comb Jelly Phylogeny & Animal Tree of Life
advertisement

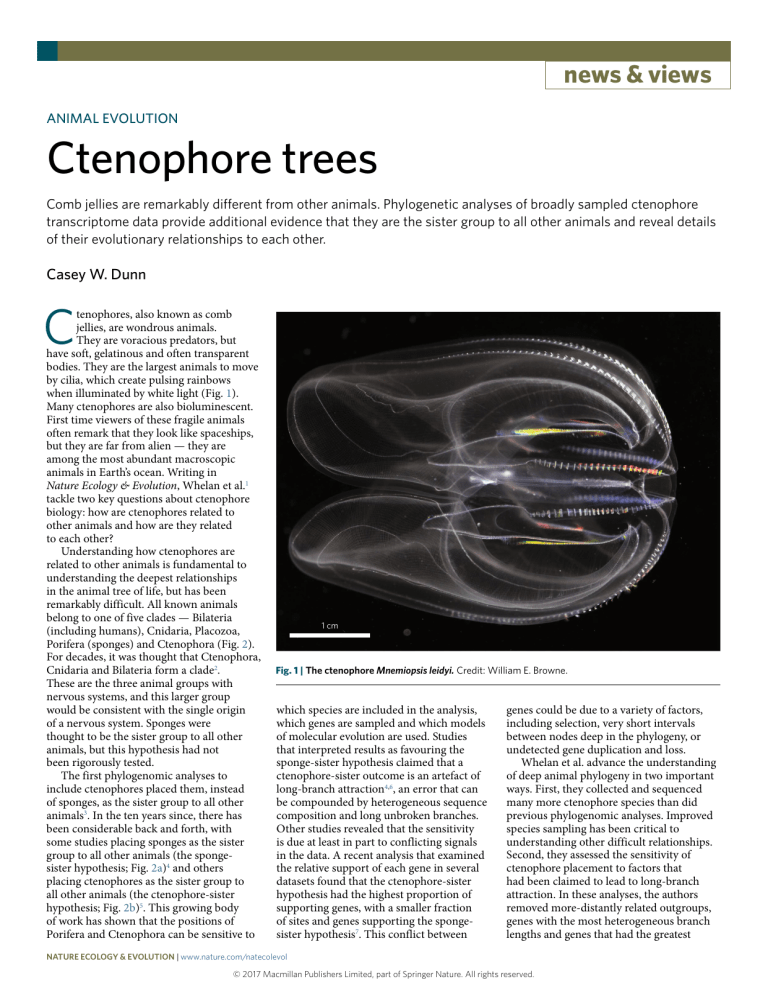
news & views ANIMAL EVOLUTION Ctenophore trees Comb jellies are remarkably different from other animals. Phylogenetic analyses of broadly sampled ctenophore transcriptome data provide additional evidence that they are the sister group to all other animals and reveal details of their evolutionary relationships to each other. Casey W. Dunn C tenophores, also known as comb jellies, are wondrous animals. They are voracious predators, but have soft, gelatinous and often transparent bodies. They are the largest animals to move by cilia, which create pulsing rainbows when illuminated by white light (Fig. 1). Many ctenophores are also bioluminescent. First time viewers of these fragile animals often remark that they look like spaceships, but they are far from alien — they are among the most abundant macroscopic animals in Earth’s ocean. Writing in Nature Ecology & Evolution, Whelan et al.1 tackle two key questions about ctenophore biology: how are ctenophores related to other animals and how are they related to each other? Understanding how ctenophores are related to other animals is fundamental to understanding the deepest relationships in the animal tree of life, but has been remarkably difficult. All known animals belong to one of five clades — Bilateria (including humans), Cnidaria, Placozoa, Porifera (sponges) and Ctenophora (Fig. 2). For decades, it was thought that Ctenophora, Cnidaria and Bilateria form a clade2. These are the three animal groups with nervous systems, and this larger group would be consistent with the single origin of a nervous system. Sponges were thought to be the sister group to all other animals, but this hypothesis had not been rigorously tested. The first phylogenomic analyses to include ctenophores placed them, instead of sponges, as the sister group to all other animals3. In the ten years since, there has been considerable back and forth, with some studies placing sponges as the sister group to all other animals (the spongesister hypothesis; Fig. 2a)4 and others placing ctenophores as the sister group to all other animals (the ctenophore-sister hypothesis; Fig. 2b)5. This growing body of work has shown that the positions of Porifera and Ctenophora can be sensitive to 1 cm Fig. 1 | The ctenophore Mnemiopsis leidyi. Credit: William E. Browne. which species are included in the analysis, which genes are sampled and which models of molecular evolution are used. Studies that interpreted results as favouring the sponge-sister hypothesis claimed that a ctenophore-sister outcome is an artefact of long-branch attraction4,6, an error that can be compounded by heterogeneous sequence composition and long unbroken branches. Other studies revealed that the sensitivity is due at least in part to conflicting signals in the data. A recent analysis that examined the relative support of each gene in several datasets found that the ctenophore-sister hypothesis had the highest proportion of supporting genes, with a smaller fraction of sites and genes supporting the spongesister hypothesis7. This conflict between genes could be due to a variety of factors, including selection, very short intervals between nodes deep in the phylogeny, or undetected gene duplication and loss. Whelan et al. advance the understanding of deep animal phylogeny in two important ways. First, they collected and sequenced many more ctenophore species than did previous phylogenomic analyses. Improved species sampling has been critical to understanding other difficult relationships. Second, they assessed the sensitivity of ctenophore placement to factors that had been claimed to lead to long-branch attraction. In these analyses, the authors removed more-distantly related outgroups, genes with the most heterogeneous branch lengths and genes that had the greatest Nature Ecology & Evolution | www.nature.com/natecolevol © 2017 Macmillan Publishers Limited, part of Springer Nature. All rights reserved. news & views a b Sponge-sister Ctenophore-sister Porifera Ctenophora Ctenophora Porifera Placozoa Placozoa Bilateria Bilateria Cnidaria Cnidaria Fig. 2 | Ctenophores and the animal tree of life. a,b, Two alternative hypotheses that have been proposed for the deepest splits in the animal phylogeny, differing in whether they place Porifera (sponges; a) or Ctenophora (comb jellies; b) as the sister group to all other animals. compositional heterogeneity, and they applied category (CAT) mixture models of evolution, which model variation in sequence composition across sites. In every case, their analyses place ctenophores as the sister group to all other animals and they find no evidence that the ctenophore-sister tree is the result of long-branch attraction. Based on these analyses, Whelan et al. argue that the ctenophore-sister result wasn’t a long-branch artefact, but that the sponge-sister result was an artefact of inadequate sampling. Consistent with this, they further dissect phylogenetic signal on a gene-by-gene basis and, like another recent analysis7, find that the majority of considered genes support the ctenophore-sister hypothesis. This provides a more nuanced perspective on the problem, and suggests that understanding the sources of the conflict between genes that they and others describe will be an important next step to moving this debate forward. The support that Whelan and colleagues provide for ctenophores’ placement as the sister group to other animals further erodes the classical, but deeply flawed, perspective that we can arrange living animals from ‘lower’ organisms that provide a snapshot of long-dead ancestors (sponges are often presented this way) to ‘higher’ and ‘moreevolved’ animals, such as bilaterians, with complex musculature and nervous systems. All animals have had the same amount of time to evolve since their most recent common ancestor, and traits have been gained and lost in each lineage. To understand this history it will be crucial to stop treating complex traits, such as the nervous system, as monolithic units, and instead consider the evolution of their parts, which may have very different histories of gain and loss8. We must also avoid viewing the biology of poorly known groups, such as ctenophores and sponges, through the lens of well-known animals, as this will always make them seem simpler and more alien than they are9. In contrast to the relationship of ctenophores to other animals, their internal relationships have received surprisingly little attention. The internal relationships recovered by Whelan et al. generally reinforce and fill out earlier findings10. It is now clear that few of the classically recognized ctenophore taxonomic groups correspond to clades and multiple traits show convergence. For example, the authors show that benthic ctenophores have been derived at least twice from a pelagic ancestor. The new analyses also suggest that the most recent common ancestor of ctenophores lived about 350 million years ago, making it much older than the more recent common ancestor of about 65 million years ago that had been proposed before10. This suggests that the length of the stem branch that gave rise to ctenophores is shorter than previously thought, which further reduces the potential for longbranch-attraction artefacts and may help explain why improved ctenophore sampling can have such a stabilizing effect on the placement of ctenophores. ❐ Casey W. Dunn Department of Ecology and Evolutionary Biology, Yale University, 165 Prospect St, New Haven, CT 06511, USA. e-mail: casey.dunn@yale.edu Published: xx xx xxxx DOI: 10.1038/s41559-017-0359-4 References 1. Whelan, N. V. et al. Nat. Ecol. Evol. https://doi.org/10.1038/ s41559-017-0331-3 (2017). 2. Wallberg, A., Thollesson, M., Farris, J. S. & Jondelius, U. Cladistics 20, 558–578 (2004). 3. Dunn, C. W. et al. Nature 452, 745–749 (2008). 4. Simion, P. et al. Curr. Biol. 27, 958–967 (2017). 5. Whelan, N. V., Kocot, K. M., Moroz, L. L. & Halanych, K. M. Proc. Natl Acad. Sci. USA 112, 5773–5778 (2015). 6. Pisani, D. et al. Proc. Natl Acad. Sci. USA 112, 15402–15407 (2015). 7. Shen, X.-X., Hittinger, C. T. & Rokas, A. Nat. Ecol. Evol. 1, 0126 (2017). 8. Liebeskind, B. J., Hillis, D. M., Zakon, H. H. & Hofmann, H. A. Trends Ecol. Evol. 31, 127–135 (2016). 9. Dunn, C. W., Leys, S. P. & Haddock, S. H. D. Trends Ecol. Evol. 30, 282–291 (2015). 10. Podar, M., Haddock, S. H., Sogin, M. L. & Harbison, G. R. Mol. Phylogenet. Evol. 21, 218–230 (2001). Competing interests The author declares no competing financial interests. Nature Ecology & Evolution | www.nature.com/natecolevol © 2017 Macmillan Publishers Limited, part of Springer Nature. All rights reserved.


