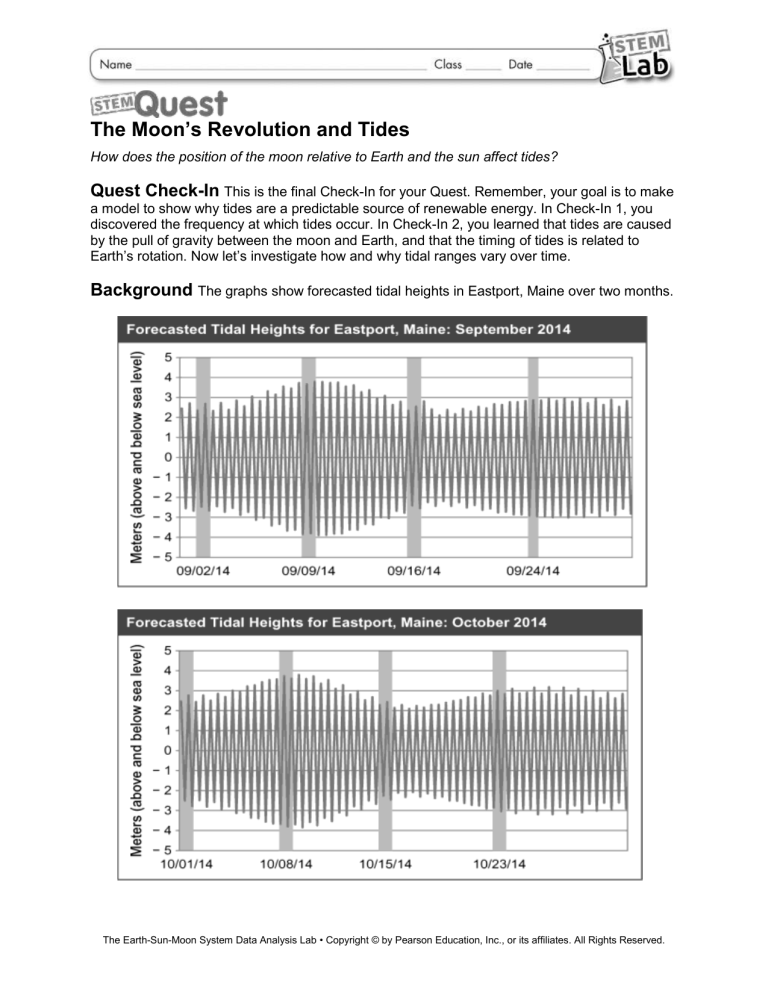
The Moon’s Revolution and Tides How does the position of the moon relative to Earth and the sun affect tides? Quest Check-In This is the final Check-In for your Quest. Remember, your goal is to make a model to show why tides are a predictable source of renewable energy. In Check-In 1, you discovered the frequency at which tides occur. In Check-In 2, you learned that tides are caused by the pull of gravity between the moon and Earth, and that the timing of tides is related to Earth’s rotation. Now let’s investigate how and why tidal ranges vary over time. Background The graphs show forecasted tidal heights in Eastport, Maine over two months. The Earth-Sun-Moon System Data Analysis Lab • Copyright © by Pearson Education, Inc., or its affiliates. All Rights Reserved. The graphs show variation in tidal ranges or one month. A tidal range is the difference in height between high and low tide. A spring tide has a large tidal range, or a large difference between water levels at high and low tides. A neap tide has a small tidal range, or a small difference between high and low tides. Spring tides and neap tides occur in regularly repeating cycles. During this investigation, you will discover what causes these repeating cycles. Analyze and Interpret Data 1. Analyze Graphs Describe the shape of the graphs and what the shape tells you about tidal ranges. 2. Quantify Change Remember that tidal range is the difference between a high tide and the low tide that immediately follows it. Use the graphs to identify the greatest tidal range and the smallest tidal range during these time periods. Circle the ranges you identified on the graph. Label your circles as either neap tide or spring tide. 3. Use Graphs A full moon occurred on September 9. Using this information label the phases of the moon that occurred on each date listed on the x-axes of the September 2014 and October 2014 graphs. 4. Recognize Patterns What pattern do you observe in the relationship between tidal ranges and phases of the moon? 5. Relate Cause and Effect Why is it important to look at more than one month’s worth of data in order to draw conclusions about tidal range patterns? The Earth-Sun-Moon System Data Analysis Lab • Copyright © by Pearson Education, Inc., or its affiliates. All Rights Reserved. 6. Develop a Model Draw two diagrams showing the positions of Earth, the sun, and the moon during the two spring tides of September 2014. Label these diagrams Spring Tide. 7. Develop a Model Now draw two diagrams showing the positions of Earth, the sun, and the moon during the two neap tides of September 2014. The view of Earth should be from the North pole. Label these diagrams First Neap Tide in September and Second Neap Tide in September. 8. Compare and Contrast Look at your diagrams showing Earth, the sun, and the moon during the spring tides. How are their relative positions alike in each diagram? How are the relative positions during spring tides different from the relative positions during neap tides? The Earth-Sun-Moon System Data Analysis Lab • Copyright © by Pearson Education, Inc., or its affiliates. All Rights Reserved. 9. Use Models In each diagram that you drew, add two arrows. One arrow should show the direction that the moon pulls on Earth’s water. The other arrow should show the direction the sun pulls on Earth’s water. 10. Construct an Explanation Explain how the motions of the Earth-sun-moon system lead to the pattern of changing tidal ranges on Earth. Use evidence from the graphs to support your explanation. Quest Follow-Up 11. Apply Scientific Reasoning Look at your diagram of the Earth, sun, and moon during a full moon. Why are the tides highest when the sun and moon are on opposite sides of Earth? (Hint: Think about why Earth has two high-tide bulges.) 12. Apply Concepts Power stations with tidal turbines use tidal currents to generate electricity. A tidal current is the flow of water into and out of a coastal area between high and low tide. The energy of a tidal current depends on the speed of the water flow. What is the relationship between tidal range and tidal currents? 13. Connect to Engineering During which phases of the moon would an underwater turbine in Eastport likely be able to generate the most energy? Explain your answer. The Earth-Sun-Moon System Data Analysis Lab • Copyright © by Pearson Education, Inc., or its affiliates. All Rights Reserved. Teacher Support Focus on NGSS Students will apply the following practices, ideas, and concepts in this activity. Science and Engineering Practices Connect to the Core Idea Crosscutting Concept Develop and use a model to describe phenomena. Patterns of the apparent motion of the sun, the moon, and stars in the sky can be observed, described, predicted, and explained with models. Patterns can be used to identify cause and effect relationships. -----------------------------------------------Connections to Nature of Science Science assumes that objects and events in natural systems occur in consistent patterns that are understandable through measurement and observation. -----------------------------------------------Connections to Engineering, Technology, and Applications of Science Engineering advances have led to important discoveries in virtually every field of science and scientific discoveries have led to the development of entire industries and engineered systems. Group Size Individuals Class Time: 30 minutes Note that the tide tables contain data for mean sea level. In some areas of the world the differences in tidal heights during high and low tide are more similar during the two monthly spring tides than they are in Eastport, Maine. The geography in the Eastport area may play a role in the smaller variation in tidal heights during the new moon spring tide compared to the full moon spring tide. Students may need some help noting that there is indeed a second spring tide during September and October. TE Annotations Analyze and Interpret Data 1. Tidal ranges vary over the month. But there is a relationship between high tides and low tides. Higher high tides lead to lower low tides and lower high tides lead to higher low tides. 2. Check that students made reasonable choices when selecting the cycle with the greatest range and the one with the smallest range. They should have labeled the one with the greatest range as a spring tide and the one with the smallest range as a neap tide. 3. Student labels should be as follows: September 2, first quarter; September 9, full moon; September 16 third quarter; September 24 new moon; October 1 first quarter; October 8 full moon; October 15 third quarter; October 23 new moon. 4. The spring tides occur during the full moon and new moon while the neap tides occur during the first and third quarter. 5. Sample answer: If we only looked at data for one month, it could be just a coincidence that spring and neap tides occur at about the same time as certain phases of the moon. The Earth-Sun-Moon System Data Analysis Lab • Copyright © by Pearson Education, Inc., or its affiliates. All Rights Reserved. Adding a second month’s worth of data provides more evidence that there is a predictable pattern. 6. Sample spring-tide diagrams, with arrows: 7. Sample neap-tide diagrams, with arrows: The Earth-Sun-Moon System Data Analysis Lab • Copyright © by Pearson Education, Inc., or its affiliates. All Rights Reserved. 8. In the spring tide diagrams, Earth, the sun, and the moon are all in a line. In the neap tide diagrams, the moon is at a right angle to the sun and Earth. 9. See arrows in sample diagrams in anno 6 and anno 7. 10. As the moon revolves around Earth, it comes into and out of alignment with the Earth and sun. When the Earth, moon, and sun line up during a full moon or new moon, the moon’s and sun’s gravity pull most strongly on Earth’s water, causing high tidal ranges, or spring tides. When the moon is at a right angle to the sun, the gravity of the moon and sun pull in opposite directions. This causes a smaller tidal range, or neap tide. Quest Follow-Up 11. Gravity pulls on Earth’s water closest to the moon, creating a tidal bulge on the side closest to the moon. It also pulls on Earth, leaving behind a second tidal bulge on the opposite side. The sun has the same effect, but from the opposite direction as the moon, so the two tidal bulges become amplified. 12. A tidal current is faster when there is a higher tidal range, because more water moves into and out of the same place in the same amount of time. 13. Underwater turbines in Eastport would generate the most energy during the spring tides, or the new moon and full moon, because this is when the tidal range is the greatest and the tidal current is fastest. The Earth-Sun-Moon System Data Analysis Lab • Copyright © by Pearson Education, Inc., or its affiliates. All Rights Reserved.


