Chi-Square & ANOVA: Goodness-of-Fit & Contingency Tests
advertisement

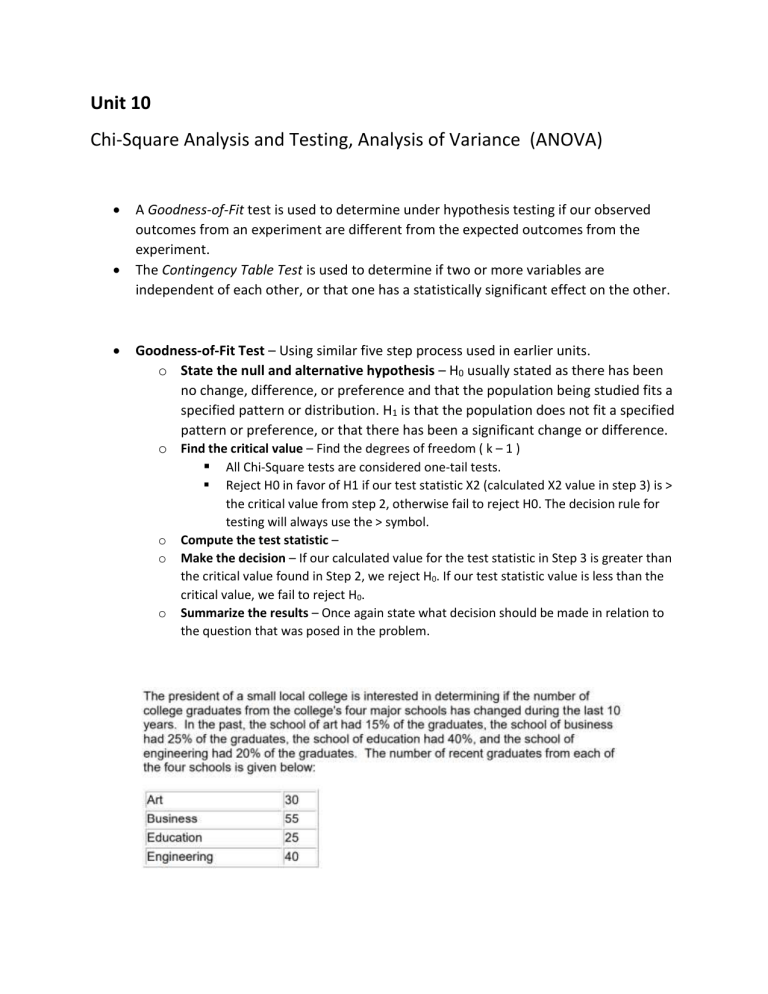
Unit 10 Chi-Square Analysis and Testing, Analysis of Variance (ANOVA) A Goodness-of-Fit test is used to determine under hypothesis testing if our observed outcomes from an experiment are different from the expected outcomes from the experiment. The Contingency Table Test is used to determine if two or more variables are independent of each other, or that one has a statistically significant effect on the other. Goodness-of-Fit Test – Using similar five step process used in earlier units. o State the null and alternative hypothesis – H0 usually stated as there has been no change, difference, or preference and that the population being studied fits a specified pattern or distribution. H1 is that the population does not fit a specified pattern or preference, or that there has been a significant change or difference. o Find the critical value – Find the degrees of freedom ( k – 1 ) All Chi-Square tests are considered one-tail tests. o o o Reject H0 in favor of H1 if our test statistic X2 (calculated X2 value in step 3) is > the critical value from step 2, otherwise fail to reject H0. The decision rule for testing will always use the > symbol. Compute the test statistic – Make the decision – If our calculated value for the test statistic in Step 3 is greater than the critical value found in Step 2, we reject H0. If our test statistic value is less than the critical value, we fail to reject H0. Summarize the results – Once again state what decision should be made in relation to the question that was posed in the problem. 1. H0: There has been no change in the past 10 years in the number of graduates from each school. The alternative hypothesis is stated as: H1: There has been a change. 2. Find the critical value. Significance (a) = 0.05. Critical value is based upon K-1 (four possible outcomes to K=4. Critical value with 3 degrees of freedom and 0.05 significance = 7.81. a. The decision rule: Reject H0 in favor of H1 if the test statistic is > 7.81. Otherwise fail to reject H0. (See Unit 10 – Sheet1 for Reference0 The Contingency Table Test Used to determine whether or not two or more variables are independent. Five Step Process o State the null and alternative hypothesis Null Hypothesis H0 – (The populations being examined are independent of each other. Alternative Hypothesis H1 – (The populations are not independent of each other). This indicates a statistically significant relationship exists between the variables. o Find the critical value Determine degrees of freedom (One-Tail) DF = (R – 1) (C – 1) o R – Number of rows in the table. o C – Number of columns in the table. o o o o You only need to use the right columns in the table. State decision rule Reject H0 in favor of H1 if our test statistic X2 (Step 3) is > the critical value from step 2, otherwise fail to reject H0. The decision rule for testing will always use the > symbol. Computer the test statistic E = (Row Total)(Column Total) / (Grand Total [of all rows and columns]) Make the decision If our calculated value for the test statistic in step 3 is greater than the critical value found in step 2, we reject the null hypothesis (H0). If our test statistic value is less than the critical value, we fail to reject the null hypothesis (H0). Summarize the results Fuck the manual problem shit we skipping straight to going over the Excel cuz I’m tired. REFERENCE SHEET 2 OF UNIT 10 EXCEL TO SOLVE


