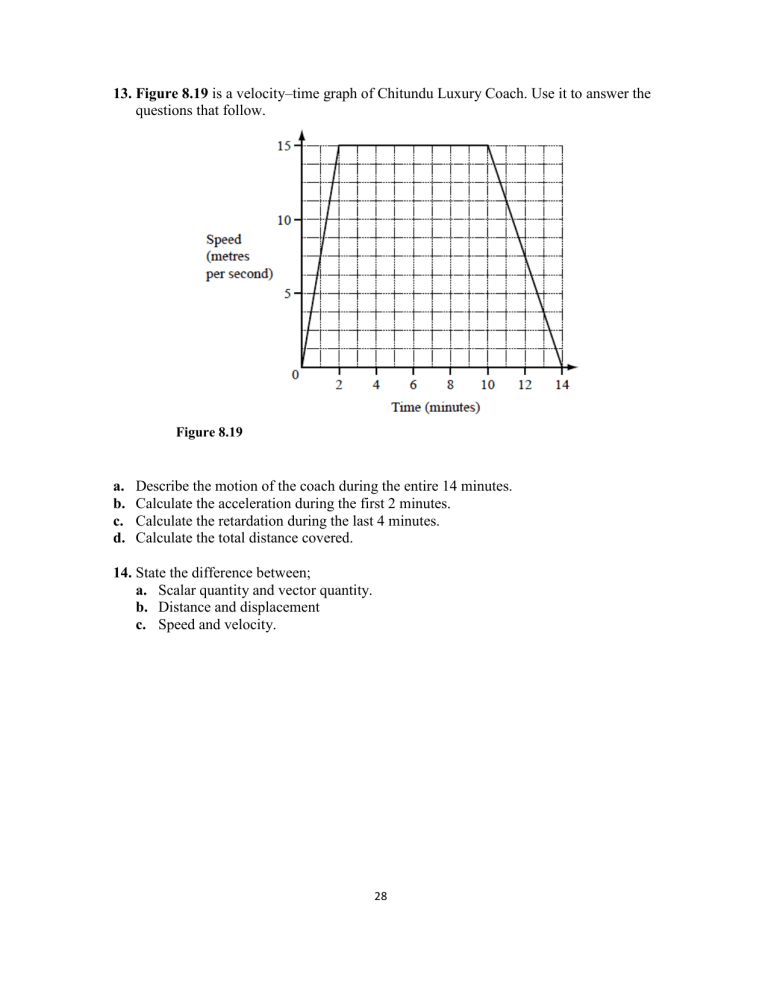
13. Figure 8.19 is a velocity–time graph of Chitundu Luxury Coach. Use it to answer the questions that follow. Figure 8.19 a. b. c. d. Describe the motion of the coach during the entire 14 minutes. Calculate the acceleration during the first 2 minutes. Calculate the retardation during the last 4 minutes. Calculate the total distance covered. 14. State the difference between; a. Scalar quantity and vector quantity. b. Distance and displacement c. Speed and velocity. 28


