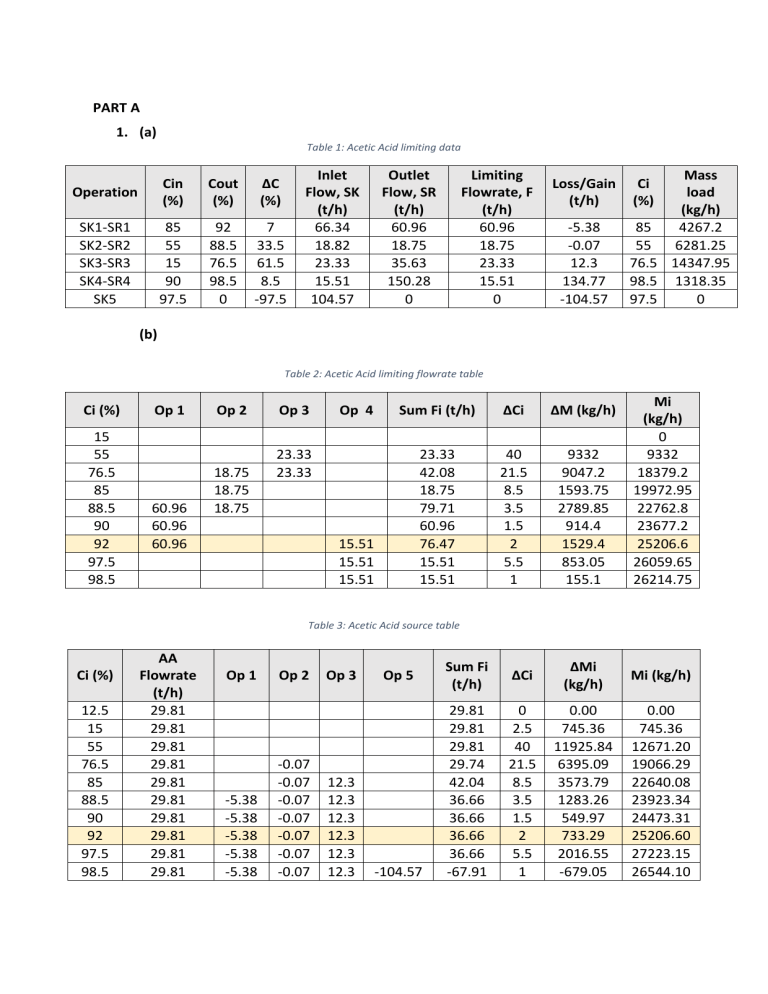
PART A 1. (a) Table 1: Acetic Acid limiting data Operation Cin (%) Cout (%) ∆C (%) SK1-SR1 SK2-SR2 SK3-SR3 SK4-SR4 SK5 85 55 15 90 97.5 92 88.5 76.5 98.5 0 7 33.5 61.5 8.5 -97.5 Inlet Flow, SK (t/h) 66.34 18.82 23.33 15.51 104.57 Outlet Flow, SR (t/h) 60.96 18.75 35.63 150.28 0 Limiting Flowrate, F (t/h) 60.96 18.75 23.33 15.51 0 Loss/Gain (t/h) -5.38 -0.07 12.3 134.77 -104.57 Mass load (kg/h) 85 4267.2 55 6281.25 76.5 14347.95 98.5 1318.35 97.5 0 Ci (%) (b) Table 2: Acetic Acid limiting flowrate table Ci (%) 15 55 76.5 85 88.5 90 92 97.5 98.5 Op 1 60.96 60.96 60.96 Op 2 18.75 18.75 18.75 Op 3 Op 4 Sum Fi (t/h) ∆Ci ∆M (kg/h) 15.51 15.51 15.51 23.33 42.08 18.75 79.71 60.96 76.47 15.51 15.51 40 21.5 8.5 3.5 1.5 2 5.5 1 9332 9047.2 1593.75 2789.85 914.4 1529.4 853.05 155.1 23.33 23.33 Mi (kg/h) 0 9332 18379.2 19972.95 22762.8 23677.2 25206.6 26059.65 26214.75 Table 3: Acetic Acid source table Ci (%) 12.5 15 55 76.5 85 88.5 90 92 97.5 98.5 AA Flowrate (t/h) 29.81 29.81 29.81 29.81 29.81 29.81 29.81 29.81 29.81 29.81 Op 1 -5.38 -5.38 -5.38 -5.38 -5.38 Op 2 -0.07 -0.07 -0.07 -0.07 -0.07 -0.07 -0.07 Op 3 12.3 12.3 12.3 12.3 12.3 12.3 Op 5 -104.57 Sum Fi (t/h) ∆Ci ∆Mi (kg/h) Mi (kg/h) 29.81 29.81 29.81 29.74 42.04 36.66 36.66 36.66 36.66 -67.91 0 2.5 40 21.5 8.5 3.5 1.5 2 5.5 1 0.00 745.36 11925.84 6395.09 3573.79 1283.26 549.97 733.29 2016.55 -679.05 0.00 745.36 12671.20 19066.29 22640.08 23923.34 24473.31 25206.60 27223.15 26544.10 Limiting composite curve 100 90 PINCH 80 Concentration (%) 70 - 0.07 t/h + 12.3 t/h 60 - 5.38 t/h - 0.07 t/h + 12.3 t/h 50 - 0.07 t/h 40 30 20 10 0 0 5000 10000 15000 20000 25000 Mass load (kg/h) AA Limi ting Flowrate AA S ource Figure 1: Acetic acid composite curve The pinch is at 92%. The minimum fresh acetic acid flowrate was determined to be 29.81 using the goal seek function on Excel to match the mass load at the pinch point for the curves of the limiting flowrate of acetic acid as well as the acetic acid source. Also by mass balance below the pinch: 25.2066 𝑡/ℎ = 𝐹𝐴𝐴(0.55 − 0.125) + (𝐹𝐴𝐴 − 0.07)(0.765 − 0.55) + (𝐹𝐴𝐴 + 12.3 − 0.07)(0.85 − 0.765) + (𝐹𝐴𝐴 − 5.38 − 0.07 + 12.3)(0.92 − 0.85) 𝐹𝐴𝐴 = 29.81 𝑡/ℎ The minimum discharge flowrate is then: 29.81 − 5.38 − 0.07 + 12.3 + 134.77 − 104.57 = 66.9 𝑡/ℎ 30000 2. Network Diagram Figure 2: AA recovery network based on limiting AA flowrate of 29.8 t/h and minimum discharge flowrate of 66.9 t/h 3. Two separation methods: a. Membrane separation b. Liquid-liquid extraction PART B 4. Table 4: Wastewater streams extracted from Q2 W (Plant) W1 (PHA) W2 (AN) W3 (VAM) W4 (WWTP) Flowrate (t/h) 5.1 61.8 Impurity (%) 92 88.5 76.5 98.5 The density of the waste streams is assumed to be equal to that of water (1000 kg/m 3). Therefore, the flowrate can be converted to L/h by: 𝐿 𝑡 1000 𝑘𝑔 1 1000 𝐿 𝐹𝑙𝑜𝑤𝑟𝑎𝑡𝑒 ( ) = 𝐹𝑙𝑜𝑤𝑟𝑎𝑡𝑒 ( ) × × × 3 ℎ ℎ 1𝑡 1000 𝑘𝑔/𝑚 1 𝑚3 The mass loading for each waste stream can be calculated by: 𝐿 𝐹𝑙𝑜𝑤𝑟𝑎𝑡𝑒 ( ) × 𝐼𝑚𝑝𝑢𝑟𝑖𝑡𝑦(%) ℎ 𝑀𝑎𝑠𝑠 𝑙𝑜𝑎𝑑𝑖𝑛𝑔 = 100 The mass of ethanol in the waste stream: 6.7𝑔 𝐿 𝐹𝑙𝑜𝑤𝑟𝑎𝑡𝑒 ( ) × 𝐿 𝑐𝑜𝑛𝑐𝑒𝑛𝑡𝑟𝑎𝑡𝑖𝑜𝑛 × 1𝑘𝑔 𝑘𝑔 ℎ 𝑀𝑎𝑠𝑠 𝑜𝑓 𝑒𝑡ℎ𝑎𝑛𝑜𝑙 ( ) = ℎ 1000 𝑔 Moles of ethanol: 𝑘𝑔 𝑘𝑔 𝑀𝑎𝑠𝑠 𝑜𝑓 𝑒𝑡ℎ𝑎𝑛𝑜𝑙 ( ) 𝑀𝑎𝑠𝑠 𝑜𝑓 𝑒𝑡ℎ𝑎𝑛𝑜𝑙 ( ) 𝑘𝑚𝑜𝑙 ℎ ℎ 𝑀𝑜𝑙𝑒𝑠 𝑜𝑓 𝑒𝑡ℎ𝑎𝑛𝑜𝑙 ( )= = 𝑘𝑔 𝑘𝑔 ℎ 𝑀𝑜𝑙𝑎𝑟 𝑚𝑎𝑠𝑠 𝑜𝑓 𝑒𝑡ℎ𝑎𝑛𝑜𝑙 ( ) 46 𝑘𝑚𝑜𝑙 𝑘𝑚𝑜𝑙 Reaction of ethanol with oxygen: C2H5OH + 3O2 2CO2 + 3H2O Moles of oxygen: 𝑘𝑚𝑜𝑙 𝑘𝑚𝑜𝑙 𝑀𝑜𝑙𝑒𝑠 𝑜𝑓 𝑜𝑥𝑦𝑔𝑒𝑛 ( ) = 3 × 𝑀𝑜𝑙𝑒𝑠 𝑜𝑓 𝑒𝑡ℎ𝑎𝑛𝑜𝑙 ( ) ℎ ℎ The theoretical oxygen or COD of ethanol: 𝑘𝑚𝑜𝑙 𝑀𝑜𝑙𝑒𝑠 𝑜𝑓 𝑜𝑥𝑦𝑔𝑒𝑛 ( ) × 32 𝑘𝑔/𝑘𝑚𝑜𝑙 1000000 𝑚𝑔 ℎ 𝐶𝑂𝐷𝑒𝑡ℎ𝑎𝑛𝑜𝑙 (𝑝𝑝𝑚) = × 𝐿 1 𝑘𝑔 𝐹𝑙𝑜𝑤𝑟𝑎𝑡𝑒 ( ) ℎ The following table summarizes the COD of ethanol in the two waste streams. Table 5: Ethanol COD in waste streams W (plant) W1 (PHA) W2 (AN) W3 (VAM) W4 (WWTP) Flowrate (L/h) Mass loading (L/h) Mass of ethanol (kg/h) Ethanol moles (kmol/h) Moles of oxygen (kmol/h) COD ethanol (kg/L) COD ethanol (ppm) 5100 4692 31.44 0.68 2.05 0.01 12864.00 - - - - - - - - - - - - - - 61800 60873 407.85 8.87 26.60 0.01 13772.87 For the COD of butyric acid, and propionic acid, the COD of acetic acid is first calculated as follows: 𝑡 𝐹𝑙𝑜𝑤𝑟𝑎𝑡𝑒 ( ) × (100 − 𝐼𝑚𝑝𝑢𝑟𝑖𝑡𝑦(%)) 1000𝑘𝑔 𝑘𝑔 ℎ 𝑀𝑎𝑠𝑠 𝑜𝑓 𝑎𝑐𝑒𝑡𝑖𝑐 𝑎𝑐𝑖𝑑 ( ) = × ℎ 100 1𝑡 Moles of acetic acid: 𝑘𝑔 𝑀𝑎𝑠𝑠 𝑜𝑓 𝑎𝑐𝑒𝑡𝑖𝑐 𝑎𝑐𝑖𝑑 ( ) ℎ 𝑘𝑔 𝑀𝑜𝑙𝑎𝑟 𝑚𝑎𝑠𝑠 𝑜𝑓 𝑎𝑐𝑒𝑡𝑖𝑐 𝑎𝑐𝑖𝑑 ( ) 𝑘𝑚𝑜𝑙 𝑘𝑔 𝑀𝑎𝑠𝑠 𝑜𝑓 𝑎𝑐𝑒𝑡𝑖𝑐 𝑎𝑐𝑖𝑑 ( ) ℎ = 𝑘𝑔 60 𝑘𝑚𝑜𝑙 𝑘𝑚𝑜𝑙 𝑀𝑜𝑙𝑒𝑠 𝑜𝑓 𝑎𝑐𝑒𝑡𝑖𝑐 𝑎𝑐𝑖𝑑 ( )= ℎ Reaction of acetic acid with oxygen: CH3COOH + 2O2 2CO2 + 2H2O 𝑘𝑚𝑜𝑙 𝑘𝑚𝑜𝑙 𝑀𝑜𝑙𝑒𝑠 𝑜𝑓 𝑜𝑥𝑦𝑔𝑒𝑛 ( ) = 2 × 𝑀𝑜𝑙𝑒𝑠 𝑜𝑓 𝑎𝑐𝑒𝑡𝑖𝑐 𝑎𝑐𝑖𝑑 ( ) ℎ ℎ The theoretical oxygen or COD of acetic acid: 𝑘𝑚𝑜𝑙 𝑀𝑜𝑙𝑒𝑠 𝑜𝑓 𝑜𝑥𝑦𝑔𝑒𝑛 ( ) × 32 𝑘𝑔/𝑘𝑚𝑜𝑙 1000000 𝑚𝑔 ℎ 𝐶𝑂𝐷𝑎𝑐𝑒𝑡𝑖𝑐 𝑎𝑐𝑖𝑑 (𝑚𝑔/𝐿) = × 𝐿 1 𝑘𝑔 𝐹𝑙𝑜𝑤𝑟𝑎𝑡𝑒 ( ) ℎ The theoretical oxygen or COD of butyric acid: 𝑚𝑔 400 𝑚𝑔 𝐶𝑂𝐷𝐵𝐴 /𝐿 𝐶𝑂𝐷𝐵𝐴 = 𝐶𝑂𝐷𝐴𝐴 × 𝑟𝑎𝑡𝑖𝑜 = 𝐶𝑂𝐷𝐴𝐴 ( ) × 𝐿 3145 𝑚𝑔 𝐶𝑂𝐷𝐴𝐴 /𝐿 The theoretical oxygen or COD of propionic acid 𝑚𝑔 400 𝑚𝑔 𝐶𝑂𝐷𝑃𝐴 /𝐿 𝐶𝑂𝐷𝑃𝐴 = 𝐶𝑂𝐷𝐴𝐴 × 𝑟𝑎𝑡𝑖𝑜 = 𝐶𝑂𝐷𝐴𝐴 ( ) × 𝐿 3145 𝑚𝑔 𝐶𝑂𝐷𝐴𝐴 /𝐿 Above calculations are summarized into the following table. Table 6: Calculated CODs for BA and PA W (plant) Flowrate (L/h) Acetic acid (kg/h) Acetic Moles of Oxygen Acid oxygen (kg/t) (kmol/h) (kmol/h) Acetic COD BA COD PA Acid (mg/L) (mg/L) COD (mg/L) 85333.33 10853.21 107555.27 W1 (PHA) W2 (AN) W3 (VAM) W4 (WWTP) 5100 408.00 6.80 13.60 85.33 - - - - - - - - 61800 927.00 15.45 30.90 16.00 16000.00 2034.98 20166.61 The total COD and subsequently BOD5 are computed and tabulated as below: Table 7: Wastewater streams data from AA network W (plant) Flowrate (t/h) W1 (PHA) W2 (AN) W3 (VAM) W4 (WWTP) 5.10 61.80 Impurity content (%) 92.00 98.50 Total COD (ppm) 131272.48 35974.46 Total BOD (ppm) 39381.74 10792.34 5. (a) Table 8: Summary of all waste streams going into the centralised filtration system Plant Flowrate (t/h) W1 (PHA) W4 (WWTP) W5 (PHA) W6 (AN) W7 (VAM) W8 (Centralised) 5.10 61.80 30.65 56.54 33.92 196.70 Impurity content (%) 92.00 98.50 79.45 93.16 68.65 45.98 Total COD (ppm) 131272.48 35974.46 221539.51 259772.48 191428.21 128205.13 Total BOD (ppm) 39381.74 10792.34 66461.85 77931.74 57428.46 38461.54 The impurity content of stream W5, W6, W7, W8 is calculated by the addition of the values of the total dissolved solids (TDS) and the total suspended solids (TSS). PHA Plant Table 9: Load table for constructing PHA plant effluent composite curve BOD (ppm) 500.00 39381.74 66461.85 FW1 (t/h) 5.10 FW5 (t/h) Sum F 30.65 30.65 ∆BOD (ppm) 35.75 30.65 38881.74 27080.11 M (t/h) Cum M (t/h) 1.39 0.83 0.00 1.39 2.22 PHA plant effluent composite curve (W1 & W5) 70000.00 BOD (ppm) 60000.00 50000.00 40000.00 30000.00 Pinch (1.39, 39381.74) 20000.00 10000.00 0.00 -0.50 0.00 0.50 1.00 1.50 2.00 2.50 Mass (t/h) Effluent curve Mini mum treatment flowrate Figure 3: PHA plant effluent composite curve With a removal ratio (RR) of 0.998, the total mass load is calculated: 𝑡 2.22 ∆𝑀𝑇 𝑡 ℎ 𝑀𝑇 = = = 2.22 0.998 0.998 ℎ The x-intercept of the minimum treatment flowrate: ∆𝑀𝑇 − 𝑀𝑇 = −0.004449 The treatment line will pass through (-0.004449, 0) until the pinch point at (1.39, 39381.74) Hence, the flowrate is: 𝑡 (1.39 − (−0.004449)) 𝑚 𝑡 ℎ 𝑇𝑟𝑒𝑎𝑡𝑚𝑒𝑛𝑡 𝑓𝑙𝑜𝑤 𝑟𝑎𝑡𝑒 = = = 35.41 ∆𝐵𝑂𝐷 39381.74 𝑝𝑝𝑚 − 0 ℎ The filtration system for the polyhydroxialkanoates (PHA) plant is shown below: Figure 4: PHA plant wastewater filtration design The cost of the PHA plant wastewater treatment system is calculated below: 𝑡 $0.8 𝑡 $0.5 $18.3 𝐶𝑜𝑠𝑡 = 2 ∗ + (35.75 − 2) ∗ = ℎ 𝑡 ℎ 𝑡 ℎ WWT Plant Table 10: Load table for constructing WWTP plant effluent composite curve BOD (ppm) FW4 (t/h) FW8 (t/h) Sum F ∆BOD (ppm) M (t/h) Cum M (t/h) 500.00 10792.34 38461.54 61.80 196.70 196.70 258.50 196.70 10292.34 27669.20 2.66 5.44 0.00 2.66 8.10 WWTP plant effluent composite curve (W4 &W8) BOD (ppm) 45000 40000 35000 30000 25000 20000 15000 10000 5000 0 -1 0 Pinch (2.66, 10792.34) 1 2 3 4 5 6 7 Mass (t/h) Effluent curve Mini mum treatment flowrate Figure 5: WWTP effluent composite curve 8 9 The total mass load is calculated as follows: 𝑡 8.10 ∆𝑀𝑇 𝑡 ℎ 𝑀𝑇 = = = 8.12 0.998 0.998 ℎ The x-intercept of the minimum treatment flowrate: ∆𝑀𝑇 − 𝑀𝑇 = −0.016239 The treatment line will pass through (-0.016239, 0) until the pinch point at (2.66, 10792.34) Hence, the flowrate is: 𝑡 (2.66 − (−0.016239)) 𝑚 𝑡 ℎ 𝑇𝑟𝑒𝑎𝑡𝑚𝑒𝑛𝑡 𝑓𝑙𝑜𝑤 𝑟𝑎𝑡𝑒 = = = 248.03 ∆𝐵𝑂𝐷 10792.34 𝑝𝑝𝑚 − 0 ℎ The filtration system for the wastewater treatment (WWT) plant is shown below: Figure 6: WWTP wastewater filtration design The cost of the wastewater treatment system is as follows: 𝑡 $0.8 𝑡 $0.5 $124.6 𝐶𝑜𝑠𝑡 = 2 ∗ + (258.5 − 2) ∗ = ℎ 𝑡 ℎ 𝑡 ℎ AN Plant Table 11: Load table for constructing AN plant effluent curve BOD (ppm) 500.00 77931.74 FW6 (t/h) ∆BOD (ppm) 56.54 77431.74 M (t/h) 0.00 4.38 AN plant effluent curve (W6) BOD (ppm) 90000.00 80000.00 70000.00 60000.00 50000.00 40000.00 30000.00 20000.00 10000.00 0.00 -1.00 0.00 1.00 2.00 3.00 4.00 5.00 Mass (t/h) Effluent curve Mini mum treatment flowrate Figure 7: AN plant effluent curve Similarly, total mass load is calculated as follows: 𝑡 4.38 ∆𝑀𝑇 𝑡 ℎ 𝑀𝑇 = = = 4.39 0.998 0.998 ℎ The x-intercept of the minimum treatment flowrate: ∆𝑀𝑇 − 𝑀𝑇 = −0.009 The treatment line will pass through (-0.009, 0) and the only one point on the curve at (4.38, 77931.74) Hence, the flowrate is: 𝑡 (4.38 − (−0.009)) 𝑚 𝑡 ℎ 𝑇𝑟𝑒𝑎𝑡𝑚𝑒𝑛𝑡 𝑓𝑙𝑜𝑤 𝑟𝑎𝑡𝑒 = = = 56.29 ∆𝐵𝑂𝐷 77931.74 𝑝𝑝𝑚 − 0 ℎ The filtration system for the Acetic Anhydrate (AN) plant is shown below: Figure 8: AN plant wastewater filtration design The cost associated with the AN plant wastewater treatment system is shown below: 𝑡 $0.8 𝑡 $0.5 $28.7 𝐶𝑜𝑠𝑡 = 2 ∗ + (56.54 − 2) ∗ = ℎ 𝑡 ℎ 𝑡 ℎ VAM Plant Table 12: Load table for constructing VAM plant effluent curve BOD (ppm) 500.00 57428.46 FW7 (t/h) ∆BOD (ppm) 33.92 10292.34 M (t/h) 0.00 0.35 VAM plant effluent curve (W7) 70000.00 60000.00 BOD (ppm) 50000.00 40000.00 30000.00 20000.00 10000.00 0.00 -0.50 0.00 0.50 1.00 1.50 2.00 2.50 Mass (t/h) Effluent cur ve Limiting treatment flowrate Figure 9: VAM plant effluent curve Total mass load: 𝑡 1.93 ∆𝑀𝑇 ℎ = 1.93 𝑡 𝑀𝑇 = = 0.998 0.998 ℎ The x-intercept of the minimum treatment flowrate: ∆𝑀𝑇 − 𝑀𝑇 = −0.004 The treatment line will pass through (-0.004, 0) and the only one point on the curve which is at (1.93, 57428.46) Hence, the flowrate is: 𝑡 (1.93 − (−0.004)) 𝑚 𝑡 ℎ 𝑇𝑟𝑒𝑎𝑡𝑚𝑒𝑛𝑡 𝑓𝑙𝑜𝑤 𝑟𝑎𝑡𝑒 = = = 33.69 ∆𝐵𝑂𝐷 57428.46 𝑝𝑝𝑚 − 0 ℎ The filtration system for the vinyl acetate monomer (VAM) plant is shown in Figure 10. Figure 10: VAM plant wastewater filtration design The cost for treating the waste at the VAM plant is then calculated as follows: 𝑡 $0.8 𝑡 $0.5 $17.4 𝐶𝑜𝑠𝑡 = 2 ∗ + (33.92 − 2) ∗ = ℎ 𝑡 ℎ 𝑡 ℎ The following table summarizes the minimum treatment flowrates and the cost associated with treating the wastewater at all four plants: Table 13: Individual wastewater treatment system summary Plant PHA (W1 & W5) WWT (W4 & W8) AN (W6) VAM (W7) Minimum treatment flowrate (t/h) 35.40907942 248.0285598 56.2898263 33.69206016 Total cost Cost ($/h) 18.30 124.61 28.74 17.45 189.11 (b) The discharge limit CDBOD is given by 500 ppm with a removal ratio of 0.998. Table 14: Load table for constructing the effluent curve of the centralised filtration system BOD (ppm) 500.00 10792.34 38461.54 39381.74 57428.46 66461.85 77931.74 Cum M (kg/h) 0.00 5.10 61.80 30.65 56.54 33.92 196.70 384.71 10292.34 3959.57 3959.57 5.10 30.65 56.54 33.92 196.70 322.91 27669.20 8934.66 12894.23 5.10 30.65 56.54 33.92 126.21 920.20 116.14 13010.37 30.65 56.54 33.92 121.11 18046.72 2185.64 15196.00 30.65 56.54 87.19 9033.39 787.62 15983.63 56.54 56.54 11469.89 648.51 16632.13 FW1 FW4 FW5 FW6 FW7 FW8 Sum F (t/h) ∆BOD (ppm) ∆M (kg/h) ∆𝑀𝑇 = 𝑅𝑅 𝑀𝑇 𝑘𝑔 16632.13 −0 ∆𝑀𝑇 ℎ𝑟 𝑀𝑇 = = = 16665.46 𝑅𝑅 0.998 Hence, 𝑀𝑇 − ∆𝑀𝑇 = 33.33 Therefore, the minimum treatment flowrate line will start from (-33.33, 0) to the pinch point. Pinch (3959.57, 10792.34) Figure 11: The effluent composite curve for the centralised filtration system The pinch concentration is at 10792.34 ppm. The treatment flowrate is: 𝑇𝑟𝑒𝑎𝑡𝑚𝑒𝑛𝑡 𝑓𝑙𝑜𝑤 𝑟𝑎𝑡𝑒 = 𝑚 (3959.57 − (−33.33))𝑘𝑔/ℎ𝑟 × 1000 = = 369.98 𝑡/ℎ𝑟 ∆𝐵𝑂𝐷 10792.34 𝑝𝑝𝑚 − 0 The concentrations of W1, W5, W6, W7, W8 streams are above the pinch concentration and thus, these streams would be all sent to the centralised filtration system. Stream W4 which is coming in at the pinch concentration would partially be treated by the system and partially bypassed. The resulting design for the centralised filtration system is shown in Figure 12. Figure 12: Design of the centralised filtration system For a flow rate of 369.7 t/h going into the centralised filtration system, the first two tonnes would cost $1.6/h. For the subsequent mass load, the cost would be $183.99/h. Therefore, the total cost for the centralised filtration system to treat the wastestream is $185.59 $/h. (c) The overall treatment cost of the centralised filtration system is slightly lower at $185/h compared to the total cost of individual filtration systems at $189.11/h. Therefore, in this case, the lower cost option which is the centralised filtration system is recommended to treat the waste streams. However, there are foreseen issues associated with a centralized filtration system which include the possibility of having to combine different technologies for the waste streams as different waste streams might require different technologies or filtration methods for an efficient treatment. Since different technologies would have different operating costs, it is recommended that the technology requirement for these different streams be further investigated so that the actual cost for these treatment plants can be effectively computed based on the method used.
