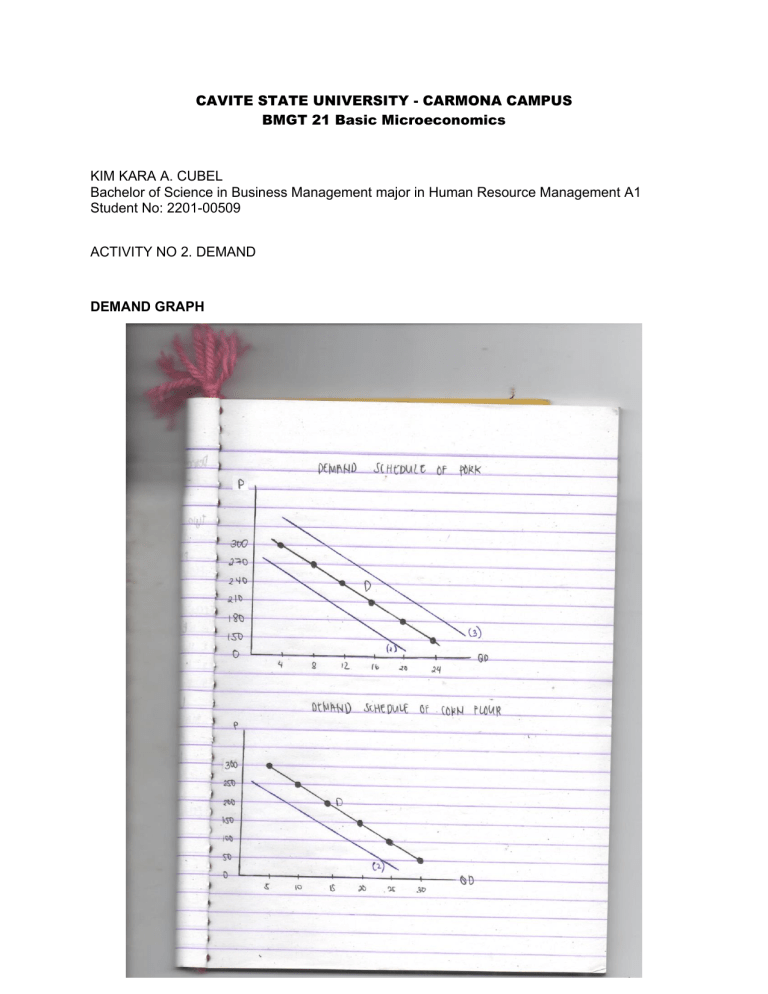
CAVITE STATE UNIVERSITY - CARMONA CAMPUS BMGT 21 Basic Microeconomics KIM KARA A. CUBEL Bachelor of Science in Business Management major in Human Resource Management A1 Student No: 2201-00509 ACTIVITY NO 2. DEMAND DEMAND GRAPH a. Situation One: Demand for pork will decrease since there's an outbreak of African swine fever. This will cause the demand curve to shift to the left. b. Situation Two. Demand for corn flour will decrease because corn flour is considered an antioxidant product. Therefore, the demand curve for corn flour will shift to the left. c. Situation Three. Demand for pork will increase since restaurants are now offering family packages and delivery promos. This will shift demand to the right. Reflection Time: a. Income. On pay day I usually order on Grab. However, if i receive an increase in my income I will start going to expensive restaurants instead of ordering and staying indoors. Therefore, this increase in income has decreased my demand for Grab and increased my demand for restaurants. b. Taste and Preferences. An example of customer taste and preferences would going to McDo and choosing salad over a hamburger - Consciously choosing one good over others. c. Price expectations. An example of price expectations would me. Me and my friend planning to purchase a particular brand of apple juice in the same store. I would be expected to 50 pesos and she would be expected to pay 70 pesos for the provide but we both find the store price to be 60 pesos.


