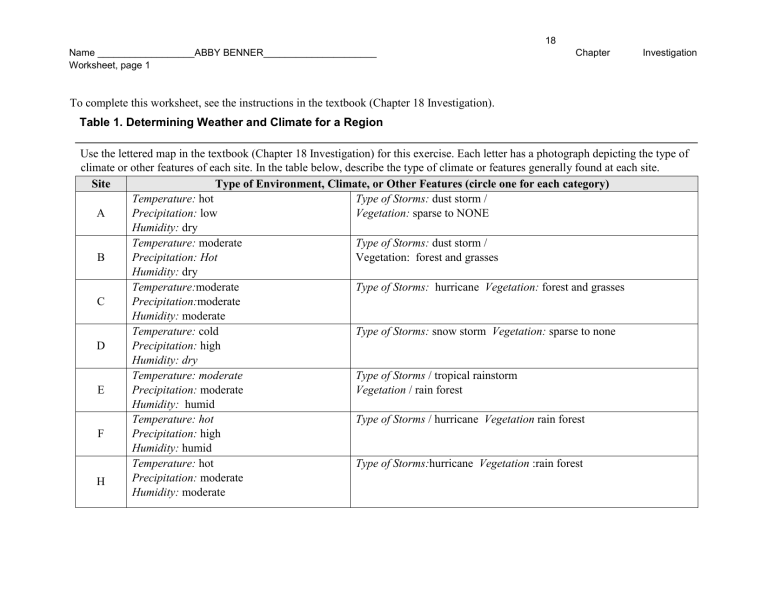
18 Name __________________ABBY BENNER_____________________ Worksheet, page 1 Chapter Investigation To complete this worksheet, see the instructions in the textbook (Chapter 18 Investigation). Table 1. Determining Weather and Climate for a Region Use the lettered map in the textbook (Chapter 18 Investigation) for this exercise. Each letter has a photograph depicting the type of climate or other features of each site. In the table below, describe the type of climate or features generally found at each site. Site Type of Environment, Climate, or Other Features (circle one for each category) Temperature: hot Type of Storms: dust storm / A Precipitation: low Vegetation: sparse to NONE Humidity: dry Temperature: moderate Type of Storms: dust storm / B Precipitation: Hot Vegetation: forest and grasses Humidity: dry Temperature:moderate Type of Storms: hurricane Vegetation: forest and grasses C Precipitation:moderate Humidity: moderate Temperature: cold Type of Storms: snow storm Vegetation: sparse to none D Precipitation: high Humidity: dry Temperature: moderate Type of Storms / tropical rainstorm E Precipitation: moderate Vegetation / rain forest Humidity: humid Temperature: hot Type of Storms / hurricane Vegetation rain forest F Precipitation: high Humidity: humid Temperature: hot Type of Storms:hurricane Vegetation :rain forest Precipitation: moderate H Humidity: moderate 18 Investigation Worksheet; page 2 I Temperature: cold / cool / moderate / hot Precipitation: low / moderate / high Humidity: dry / moderate / humid / unknown Type of Storms: dust storm / snow storm / tropical rainstorm / hurricane Vegetation: sparse to none / forest and grasses / rain forest Chapter Table 2. Interpretation of the Effects of Ocean Currents, Prevailing Winds, and Sea Temperatures For each map below, label your interpretation of the effects of ocean currents, prevailing winds, and sea surface temperatures, based on the location of the continents. Preliminary Interpretation of Ocean Currents: Label on this map your interpretation of whether each ocean current is warm (W), cold (C), or neither (N). In the space below, justify some of your interpretations. In this map, it is hottest around the equator and lowest in temperature there. As you go south it it gets warmer until you meet the continental poles. The currents appear to be relatively gentle with winds that are prevailing in the opposite direction as the ocean currents. The altitude is highest at the poles and as you reach towards the equator the altitude is low and has higher precipitation. Prevailing winds are relative to the position of the sun. 18 Investigation Worksheet; page 3 Preliminary Interpretation of Winds: Label some areas on land where you think the prevailing winds will bring warmth (W), coolness (C), precipitation (P), dryness (D), or some combination (e.g. WP). In the space below, justify some of your interpretations. COLD IS FLOWING IN FROM THE FAR NORTH AND SOUTH WHILE THE WEATHER IS QUITE THE OPPOSITE NEAR THE EQUATOR AND THE LOWER YOU GO, THE WETTER ITS GOING TO BE. Name _______________________________________ Chapter Table 3. Climate Analysis rain forest(R), deserts (D), and lands at highest risk for hurricanes (H). Write the appropriate letter at that location on the map and then use colored pencils to shade in the extent of land associated with each letter. 18 Investigation Worksheet; page 4 Chapter Table 4. Climate Analysis 18 Investigation Worksheet; page 5 Use a copy of the previous map to label areas you interpret will be the following climate types: (label at least two areas of each type): • • • • • Tropical (A-type) climate Hot, arid (some B-type) climate Warm, temperate climate (warm C-types) Colder, mid-latitude climate (cold C-type and D-type) Subarctic and polar climate (very cold D-types and E-types) Reference Map (you can print out this page for reference, but you will not turn it in)
