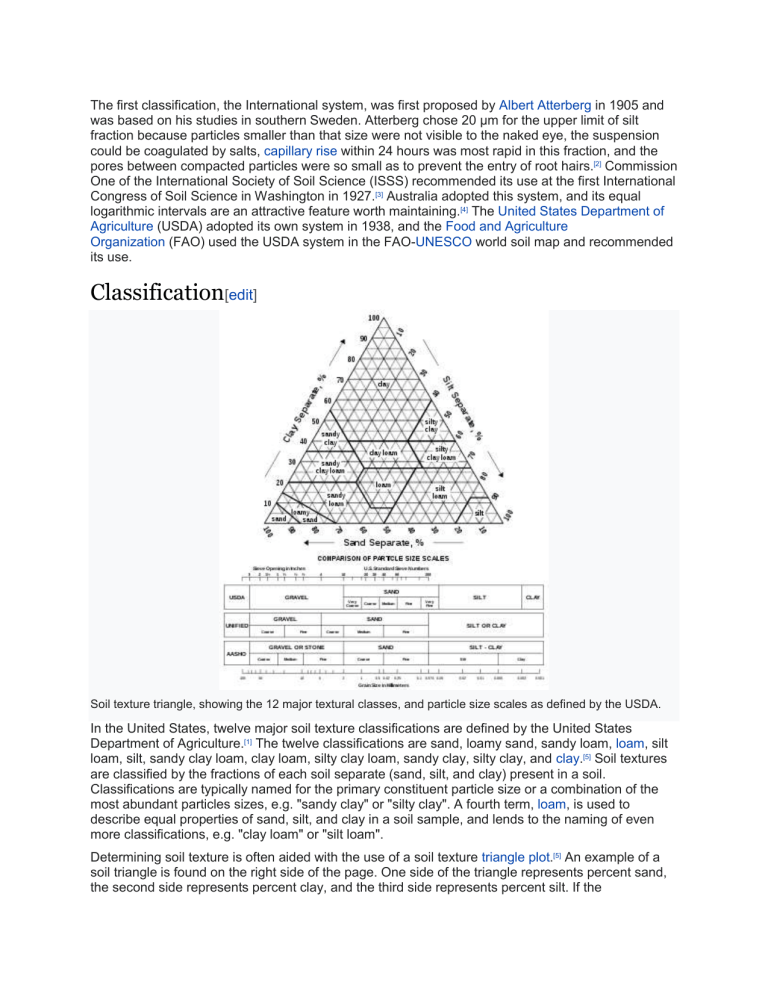
The first classification, the International system, was first proposed by Albert Atterberg in 1905 and was based on his studies in southern Sweden. Atterberg chose 20 μm for the upper limit of silt fraction because particles smaller than that size were not visible to the naked eye, the suspension could be coagulated by salts, capillary rise within 24 hours was most rapid in this fraction, and the pores between compacted particles were so small as to prevent the entry of root hairs.[2] Commission One of the International Society of Soil Science (ISSS) recommended its use at the first International Congress of Soil Science in Washington in 1927.[3] Australia adopted this system, and its equal logarithmic intervals are an attractive feature worth maintaining.[4] The United States Department of Agriculture (USDA) adopted its own system in 1938, and the Food and Agriculture Organization (FAO) used the USDA system in the FAO-UNESCO world soil map and recommended its use. Classification[edit] Soil texture triangle, showing the 12 major textural classes, and particle size scales as defined by the USDA. In the United States, twelve major soil texture classifications are defined by the United States Department of Agriculture.[1] The twelve classifications are sand, loamy sand, sandy loam, loam, silt loam, silt, sandy clay loam, clay loam, silty clay loam, sandy clay, silty clay, and clay.[5] Soil textures are classified by the fractions of each soil separate (sand, silt, and clay) present in a soil. Classifications are typically named for the primary constituent particle size or a combination of the most abundant particles sizes, e.g. "sandy clay" or "silty clay". A fourth term, loam, is used to describe equal properties of sand, silt, and clay in a soil sample, and lends to the naming of even more classifications, e.g. "clay loam" or "silt loam". Determining soil texture is often aided with the use of a soil texture triangle plot.[5] An example of a soil triangle is found on the right side of the page. One side of the triangle represents percent sand, the second side represents percent clay, and the third side represents percent silt. If the percentages of sand, clay, and silt in the soil sample are known, then the triangle can be used to determine the soil texture classification. For example, if a soil is 70 percent sand and 10 percent clay then the soil is classified as a sandy loam. The same method can be used starting on any side of the soil triangle. If the texture by feel method was used to determine the soil type, the triangle can also provide a rough estimate on the percentages of sand, silt, and clay in the soil. Chemical and physical properties of a soil are related to texture. Particle size and distribution will affect a soil's capacity for holding water and nutrients. Fine textured soils generally have a higher capacity for water retention, whereas sandy soils contain large pore spaces that allow leaching.[6]
