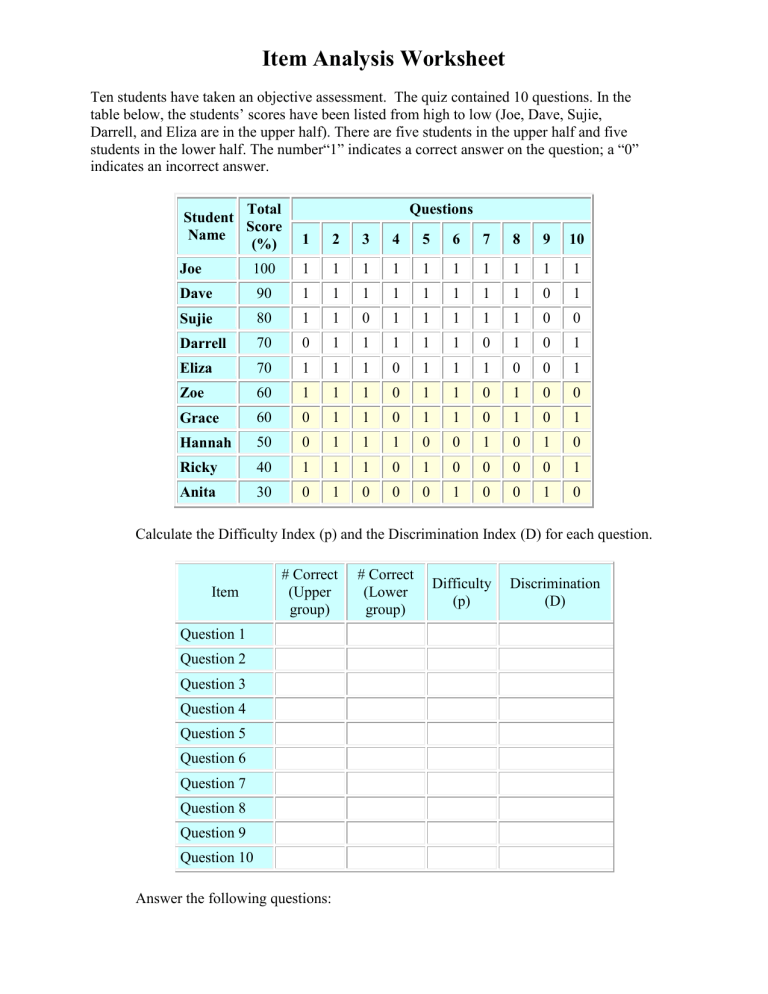
Item Analysis Worksheet Ten students have taken an objective assessment. The quiz contained 10 questions. In the table below, the students’ scores have been listed from high to low (Joe, Dave, Sujie, Darrell, and Eliza are in the upper half). There are five students in the upper half and five students in the lower half. The number“1” indicates a correct answer on the question; a “0” indicates an incorrect answer. Total Student Score Name (%) Questions 1 2 3 4 5 6 7 8 9 10 Joe 100 1 1 1 1 1 1 1 1 1 1 Dave 90 1 1 1 1 1 1 1 1 0 1 Sujie 80 1 1 0 1 1 1 1 1 0 0 Darrell 70 0 1 1 1 1 1 0 1 0 1 Eliza 70 1 1 1 0 1 1 1 0 0 1 Zoe 60 1 1 1 0 1 1 0 1 0 0 Grace 60 0 1 1 0 1 1 0 1 0 1 Hannah 50 0 1 1 1 0 0 1 0 1 0 Ricky 40 1 1 1 0 1 0 0 0 0 1 Anita 30 0 1 0 0 0 1 0 0 1 0 Calculate the Difficulty Index (p) and the Discrimination Index (D) for each question. Item # Correct (Upper group) Question 1 Question 2 Question 3 Question 4 Question 5 Question 6 Question 7 Question 8 Question 9 Question 10 Answer the following questions: # Correct (Lower group) Difficulty (p) Discrimination (D) 1.Which question was the easiest? 2. Which question was the most difficult? 3. Which item has the poorest discrimination? 4. Which questions would you eliminate first (if any) – why?
