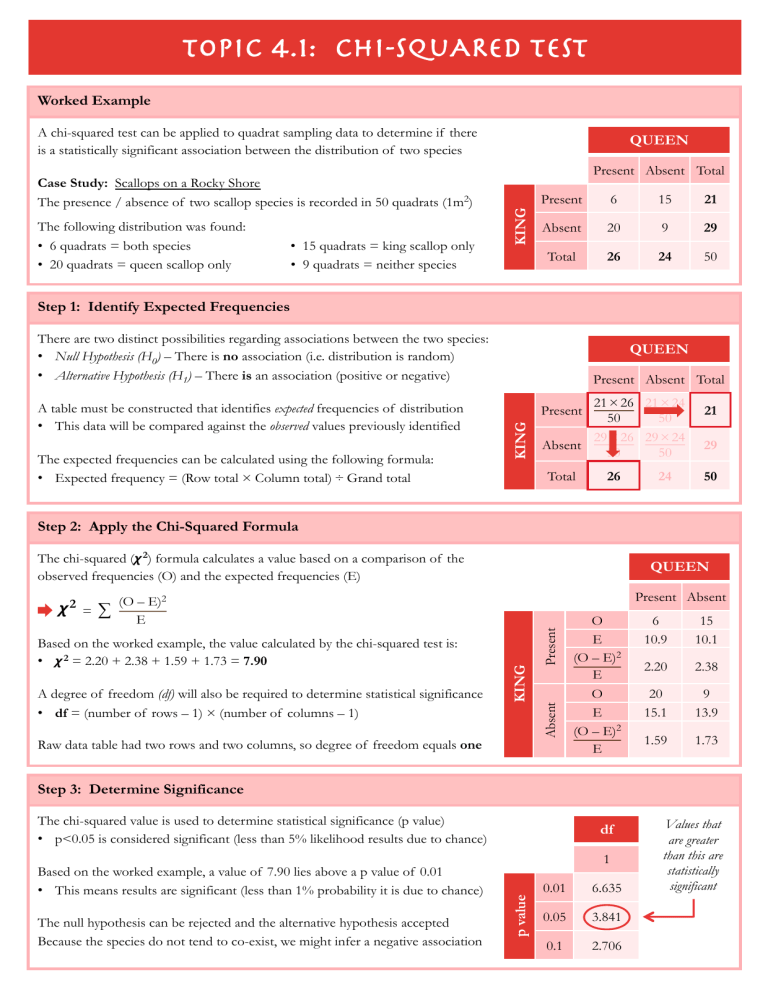
Topic 4.1: CHI-SquARED TesT Worked Example A chi-squared test can be applied to quadrat sampling data to determine if there is a statistically significant association between the distribution of two species The following distribution was found: • 6 quadrats = both species • 20 quadrats = queen scallop only • 15 quadrats = king scallop only • 9 quadrats = neither species Present Absent Total KING Case Study: Scallops on a Rocky Shore The presence / absence of two scallop species is recorded in 50 quadrats (1m2) QUEEN Present 6 15 21 Absent 20 9 29 Total 26 24 50 Step 1: Identify Expected Frequencies There are two distinct possibilities regarding associations between the two species: • Null Hypothesis (H0) – There is no association (i.e. distribution is random) • Alternative Hypothesis (H1) – There is an association (positive or negative) The expected frequencies can be calculated using the following formula: • Expected frequency = (Row total × Column total) ÷ Grand total Present Absent Total 21 × 26 21 × 24 50 50 29 × 26 29 × 24 Absent 50 50 Present KING A table must be constructed that identifies expected frequencies of distribution • This data will be compared against the observed values previously identified QUEEN Total 26 24 21 29 50 Step 2: Apply the Chi-Squared Formula The chi-squared (𝟀2) formula calculates a value based on a comparison of the observed frequencies (O) and the expected frequencies (E) Present Absent (O – E)2 E Based on the worked example, the value calculated by the chi-squared test is: • 𝟀2 = 2.20 + 2.38 + 1.59 + 1.73 = 7.90 A degree of freedom (df) will also be required to determine statistical significance • df = (number of rows – 1) × (number of columns – 1) Raw data table had two rows and two columns, so degree of freedom equals one Present ∑ O E (O – E)2 E 6 10.9 15 10.1 2.20 2.38 Absent = KING 𝟀2 QUEEN O E (O – E)2 E 20 15.1 9 13.9 1.59 1.73 Step 3: Determine Significance The chi-squared value is used to determine statistical significance (p value) • p<0.05 is considered significant (less than 5% likelihood results due to chance) The null hypothesis can be rejected and the alternative hypothesis accepted Because the species do not tend to co-exist, we might infer a negative association 1 p value Based on the worked example, a value of 7.90 lies above a p value of 0.01 • This means results are significant (less than 1% probability it is due to chance) df 0.01 6.635 0.05 3.841 0.1 2.706 Values that are greater than this are statistically significant


