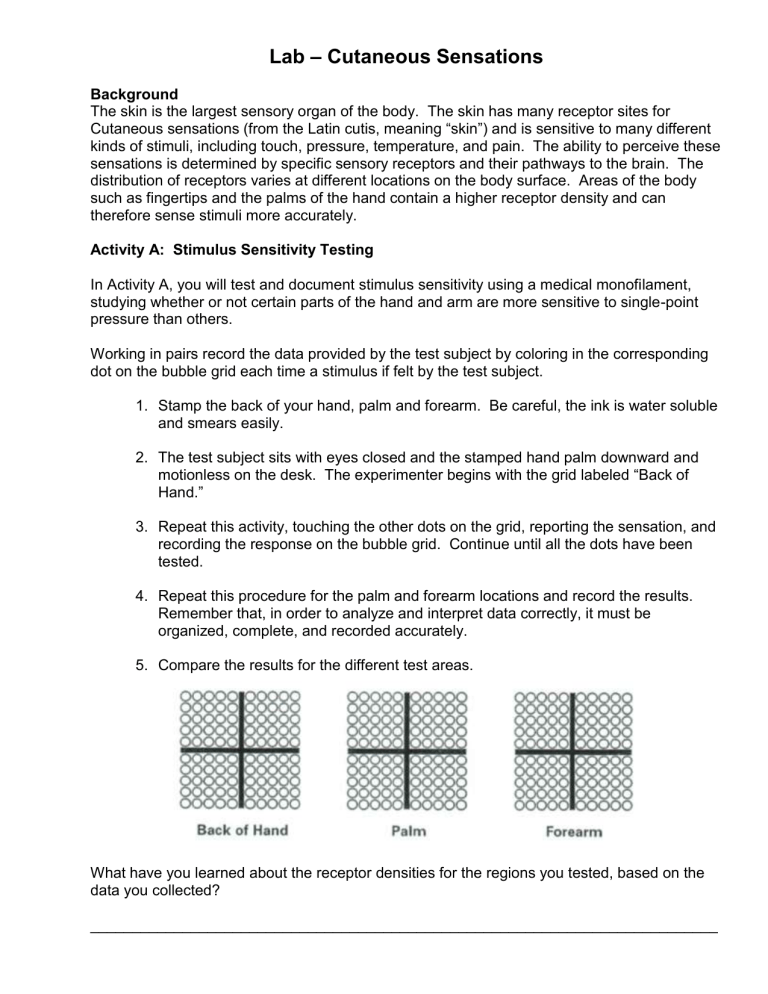
Lab – Cutaneous Sensations Background The skin is the largest sensory organ of the body. The skin has many receptor sites for Cutaneous sensations (from the Latin cutis, meaning “skin”) and is sensitive to many different kinds of stimuli, including touch, pressure, temperature, and pain. The ability to perceive these sensations is determined by specific sensory receptors and their pathways to the brain. The distribution of receptors varies at different locations on the body surface. Areas of the body such as fingertips and the palms of the hand contain a higher receptor density and can therefore sense stimuli more accurately. Activity A: Stimulus Sensitivity Testing In Activity A, you will test and document stimulus sensitivity using a medical monofilament, studying whether or not certain parts of the hand and arm are more sensitive to single-point pressure than others. Working in pairs record the data provided by the test subject by coloring in the corresponding dot on the bubble grid each time a stimulus if felt by the test subject. 1. Stamp the back of your hand, palm and forearm. Be careful, the ink is water soluble and smears easily. 2. The test subject sits with eyes closed and the stamped hand palm downward and motionless on the desk. The experimenter begins with the grid labeled “Back of Hand.” 3. Repeat this activity, touching the other dots on the grid, reporting the sensation, and recording the response on the bubble grid. Continue until all the dots have been tested. 4. Repeat this procedure for the palm and forearm locations and record the results. Remember that, in order to analyze and interpret data correctly, it must be organized, complete, and recorded accurately. 5. Compare the results for the different test areas. What have you learned about the receptor densities for the regions you tested, based on the data you collected? ___________________________________________________________________________ Activity B: Two-Point Discrimination In Activity B, you will map and measure the receptor density and receptor field size of different parts of the body using two-point discriminators to identify two-point thresholds. Working in pairs, record the data provided by the test subject by filling in the blanks in the data table below. Test five different locations three times each. Gather data from the following body areas: fingertip, palm forearm, back of the neck, and back of the lower leg (calf). 1. The test subject sits with eyes closed and one hand palm upward and motionless on the desk. The experimenter begins by testing the fingertip. 2. Start with the two points on the two-point discriminator touching each other. In increments of 1-2 mm, gradually increase the distance between the two points. Test the subject’s skin after each adjustment. Each time the two points are touched to the skin, ask the test subject whether he or she feels only one point or two distinct points. 3. Repeat this procedure until the test subject reports feeling two distinct contact points. The measurement at which two distinct points are felt is called the “two-point threshold.” This value is obtained by reading the number found between the two arrows in the middle of the sliding scale on the two-point discriminator. Record the test subject’s two-point threshold in the “Trial 1” column of the data table. 4. Repeat steps 2 and 3, obtaining a two-point threshold measurement for the following areas of the test subject’s body: the palm of the hand, the forearm, the back of the neck, and the lower leg (calf). Record each of these results in the “Trial 1” column of the data table. 5. Conduct two additional trials for each of these locations, following the procedures above. Record the results in the “Trial 2” and “Trial 3” columns of the data table. Are some locations more sensitive than others? ________ Activity C: Temperature Sensation In Activity C, you will study cutaneous sensitivity to hot and cold stimuli. Working in pairs, record the data provided by the test subject by coloring the corresponding dot on the bubble grid each time a stimulus is felt by the test subject. 1. Pick up an aluminum temperature probe from the cold water beaker and wipe it dry with a towel 2. The test subject sits with eyes closed and the stamped hand palm downward and motionless on the desk. The experimenter begins with the grid labeled “Back of Hand.” 3. The experimenter begins in one quadrant of the dot grid and gently touches each dot with the temperature probe. The probe should remain on each dot for about two seconds. The test subject reports whether or not he or she feels a cool stimulus. You may have to re-cool the temperature probe periodically during the lab. 4. Repeat this activity, touching the other dots on the grid, reporting the sensation, and recording the response on the bubble grid. Continue until all of the dots have been tested. 5. Repeat this procedure for the palm and forearm locations and record the results. Remember that, in order to analyze and interpret data correctly, it must be organized, complete, and recorded accurately. 6. Repeat steps 1 through 5, this time using a warm temperature probe to map warmth receptors. Follow the same protocol, mapping warmth receptors for the back of the hand, the palm, and the forearm. You may have to periodically re-warm the temperature probe during the lab. Did you identify more warm or cold receptor sites? ______________________ Did different areas sense heat and cold differently? ________ Why? ________________________________________________________________


