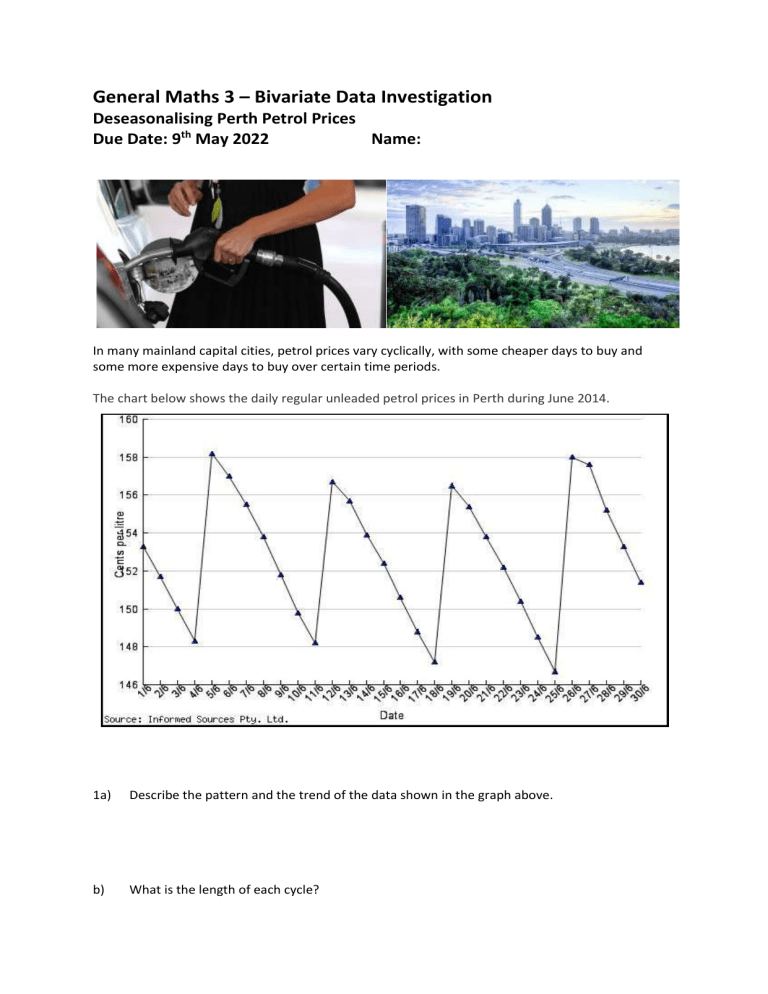
General Maths 3 – Bivariate Data Investigation Deseasonalising Perth Petrol Prices Due Date: 9th May 2022 Name: In many mainland capital cities, petrol prices vary cyclically, with some cheaper days to buy and some more expensive days to buy over certain time periods. The chart below shows the daily regular unleaded petrol prices in Perth during June 2014. 1a) Describe the pattern and the trend of the data shown in the graph above. b) What is the length of each cycle? The following chart shows the daily regular unleaded petrol prices in Perth from 14th Jan to 25th March this year (2022). 2. a) What do you notice about the length of the cycle of this year’s prices? b) Read the following article and explain what has happened. https://www.miragenews.com/change-to-perths-petrol-price-cycle-649962/ 3 Using the data in the previous graph, describe when it is the most expensive and when is it cheapest to buy petrol in Perth? Describe any trends in the months of data you have. 4 Suggest possible reasons for this fortnightly cycle. 5 Your main task is to deseasonalise the Perth petrol price data and determine any underlying trend using the skills and ideas we have discussed over the BiVa Data unit covered in class. This should be done using an Excel Spreadsheet. You are to extract the raw data from the chart in part 2. Note that there are instructions on how to use Excel on page 30 of your text. Additionally there is a copy of a spreadsheet that deseasonalises the Pizza Shop example shared on our Teams page (see below). You will need to provide a printed copy of the spreadsheet showing your figures in addition to a print out of you graph showing both the raw and deseasonalised data. 6 Describe the longer term trend, over the ten weeks that this data shows. 7 Are there any days in your data where the petrol price is especially high or low in deseasonalised terms? Provide an explanation for these anomalies. 8 Using your spreadsheet (or your Calculator), carry out a linear regression of the deseasonalised data and find the equation of this line. 9 Forecast the actual price of petrol in Perth for the following dates (include all working):. a) 5 April 2022 b) 6 April 2022 ‘ 10 Comment on the reliability of your predictions for the previous two questions. 11 The ‘PetrolSpy’ website tracks daily fuel prices for Capital Cities within Australia and the following link shows the graph for the petrol price for the last 45 days in Perth. Click on the link below to access the latest graph. Fuel Price Cycle Graph for Perth, Australia - Petrol Spy Use this data to comment on your previous forecasts and discuss potentiall reasons for any discrepancies (include a copy of this chart in your report). Comment on the most recent cycle in comparison to previous fortnights.


