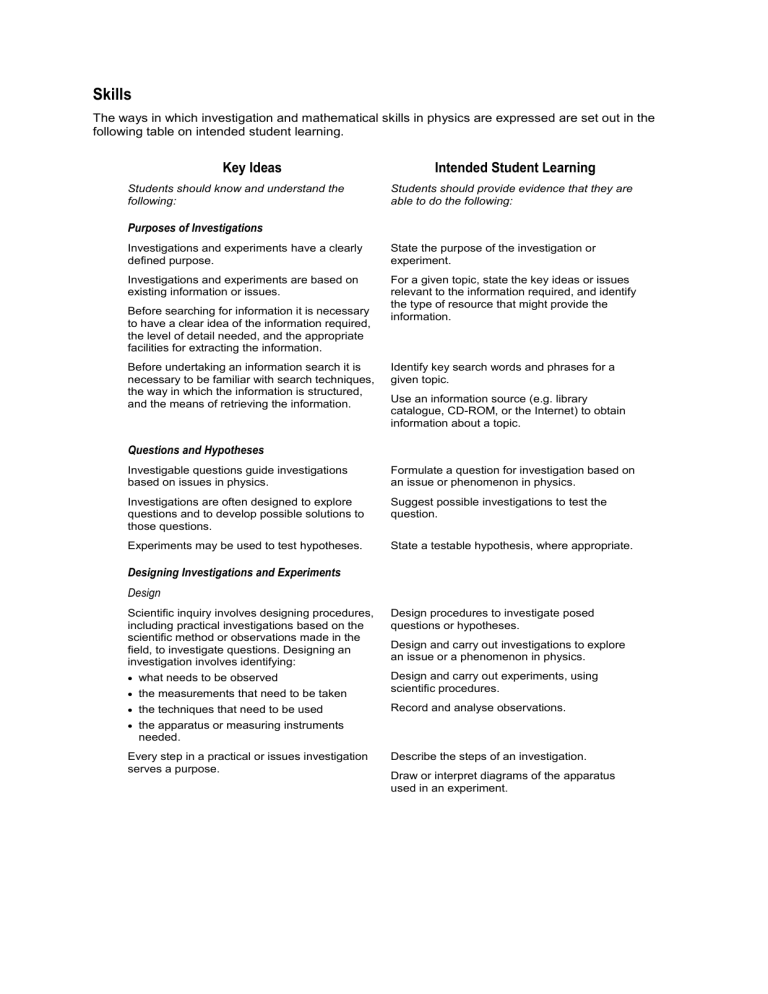
Skills The ways in which investigation and mathematical skills in physics are expressed are set out in the following table on intended student learning. Key Ideas Students should know and understand the following: Intended Student Learning Students should provide evidence that they are able to do the following: Purposes of Investigations Investigations and experiments have a clearly defined purpose. State the purpose of the investigation or experiment. Investigations and experiments are based on existing information or issues. For a given topic, state the key ideas or issues relevant to the information required, and identify the type of resource that might provide the information. Before searching for information it is necessary to have a clear idea of the information required, the level of detail needed, and the appropriate facilities for extracting the information. Before undertaking an information search it is necessary to be familiar with search techniques, the way in which the information is structured, and the means of retrieving the information. Identify key search words and phrases for a given topic. Use an information source (e.g. library catalogue, CD-ROM, or the Internet) to obtain information about a topic. Questions and Hypotheses Investigable questions guide investigations based on issues in physics. Formulate a question for investigation based on an issue or phenomenon in physics. Investigations are often designed to explore questions and to develop possible solutions to those questions. Suggest possible investigations to test the question. Experiments may be used to test hypotheses. State a testable hypothesis, where appropriate. Designing Investigations and Experiments Design Scientific inquiry involves designing procedures, including practical investigations based on the scientific method or observations made in the field, to investigate questions. Designing an investigation involves identifying: what needs to be observed the measurements that need to be taken the techniques that need to be used the apparatus or measuring instruments needed. Design procedures to investigate posed questions or hypotheses. Every step in a practical or issues investigation serves a purpose. Describe the steps of an investigation. Design and carry out investigations to explore an issue or a phenomenon in physics. Design and carry out experiments, using scientific procedures. Record and analyse observations. Draw or interpret diagrams of the apparatus used in an experiment. Key Ideas Students should know and understand the following: Intended Student Learning Students should provide evidence that they are able to do the following: Variables Many practical investigations involve deliberately changing one quantity and determining the effect on another quantity. These quantities are referred to as ‘variables’. Identify the variables in a practical investigation. The quantity being deliberately changed is called the ‘independent variable’. The quantity that changes as a result, and is measured, is called the ‘dependent variable’. Classify appropriate variables in a practical investigation as independent or dependent. Other variables are held constant, if possible, throughout a practical investigation. Identify any variables that are deliberately held constant throughout a practical investigation. Conducting Investigations Procedures Practical investigations require a particular set of actions to be carried out in a well-defined order. Follow instructions accurately and safely. Safety and Ethics Ethical practices must be followed when conducting practical or issues investigations. Maintain confidentiality, report accurately, and acknowledge the work of other people. Safety must be considered when conducting investigations. Recognise hazards and work safely during an investigation. Many investigations involve the collaborative efforts of a team. Negotiate procedures with the other members of the team. Define the role of each member. Work as a member of a team. Perform the role of a member of a team. Errors in Measurements Measurements are affected by random and/or systematic errors. Identify sources of errors and uncertainty that may occur in a practical investigation. Random errors are present when there is scatter in the measured values. Systematic errors are present when measured values differ consistently from the true value. Distinguish between random and systematic errors. Where applicable, increasing the number of samples or repeating a practical investigation minimises the effects of random errors and improves the reliability of the data. Explain the importance of increasing the number of samples in a practical investigation. Systematic errors can be identified and results verified by repeating a practical investigation, using an alternative source of equipment and materials. Explain the importance of repeating a practical investigation where feasible. Reliability, Precision, and Accuracy The reliability/precision of data collection is related to the reproducibility of the measurements. Where possible, collect data using measurements that can be reproduced consistently. Measurements are more reliable when there is less scatter in the results. Determine which of two or more measuring instruments or sets of measurements is most reliable/precise. Key Ideas Intended Student Learning Students should know and understand the following: Students should provide evidence that they are able to do the following: Reliability/precision depends on the extent to which random errors are minimised. Use averages or graphing as a means of detecting or minimising the effects of random errors. The accuracy of an experimental value indicates how close the result is to the true value and depends on the extent to which systematic errors are minimised. State which result of two or more experiments is most accurate, given the true value. The resolution of a measuring instrument is the smallest increment measurable by the measuring instrument. Select an instrument of appropriate resolution for a measurement. The number of significant figures for a measurement is determined by the reproducibility of the measurement and the resolution of the measuring instrument. Record and use measurements to an appropriate number of significant figures. Information and Data Valid conclusions depend on the gathering of appropriate evidence. Make and record careful and honest observations and measurements in an investigation. Data can be easily interpreted if presented in a well-structured table. Present data in an appropriate tabular form. Include a title, column headings showing the quantities measured or observations made and the units used, and the values recorded to an appropriate number of significant figures. Graphs are a useful way of displaying some forms of data. When a graph is plotted, the independent variable (or a quantity derived from it) is plotted horizontally and the dependent variable (or a quantity derived from it) is plotted vertically. Plot a graph of a dependent variable versus an independent variable. Include a title, labelled axes, and appropriate scales and units. A line of best fit can show relationships between variables in an experiment. Draw a line of best fit through a series of points on a graph, such that the plotted points are scattered evenly above and below the line of best fit. Understanding of a topic, issue, or question is enhanced by the use of information from different sources. Obtain information from different sources. Information obtained must be critically examined for accuracy and for its suitability for the purpose for which it was sought. Evaluate for bias, credibility, accuracy, and suitability the information obtained from a source. The source of information used must be recorded so that the information is accessible to others. List the sources of the information, using an appropriate format. Interpretation and Evaluation Careful observation in a practical investigation is essential for analysis and for comparison with other investigations. Describe a pattern observed in the results of an investigation. The scatter of data points above and below the line of best fit is probably due to random errors. Using the scatter in the graphs of data from similar investigations, compare the random errors. Key Ideas Intended Student Learning Students should know and understand the following: Students should provide evidence that they are able to do the following: The slope of the line of best fit represents the ratio of the change in the dependent variable to the change in the independent variable, and may have physical significance. Given a straight-line graph of two quantities, determine the slope of the line of best fit and state its units. The intercept(s) of the line of best fit may also have physical significance and may indicate the existence of a systematic error. Given a straight-line graph of two quantities, determine the intercept(s) of the line of best fit and state any physical significance of the intercept(s). If a straight line of best fit passes through the origin of the graph and is a good representation of the data, the plotted quantities are directly proportional to each other. Using a graph that has a straight line of best fit through the origin, describe the relationship between the two plotted variables. Variables resulting in curved graphs may be interpreted by plotting one of the variables in the Use a graph of y 1 x and y 1 x2 to investigate the relationship between the two variables. 2 form 1 x or 1 x . Using the line of best fit on a graph and the measured slope of the graph, write an equation between the variables in the form y mx c. Distinguish between proportionality and linear dependence. Interpret a straight line through the origin of y 1 x as an inverse relationship, and y 1 x2 as an inverse square relationship. Subsequent investigations can be improved by the critical evaluation of the procedure and results. Analyse and evaluate information from a series of observations or an investigation and suggest improvements or the additional information needed. A conclusion should be written at the end of each investigation. Write a conclusion that is based on the results of an investigation and is related to the question posed and the purpose of, or the hypothesis for, the investigation. Alternative Views The evidence collected through investigations may be interpreted in a variety of ways. Describe a range of alternative interpretations based on evidence, and state reasons for the selection of the preferred interpretation. Different sources can be used to present arguments for and against an issue. Construct for-and-against arguments on an issue based on information gathered from different credible sources. Personal views must be substantiated by the evidence collected in an investigation. Present a justification of, or evidence for, a personal view. Communication Specific terminology, conventions, and symbols are used for communicating in physics. Use the terminology, conventions, and symbols of physics that are appropriate to the purpose of the communication. Communication for different audiences requires the use of a format suitable for the purpose. Choose the format that is appropriate to the audience. All communication needs to be well structured, well organised, and clearly presented. Present communications (oral, written, and multimedia) clearly and logically, using the concepts of physics that are appropriate to the audience. Key Ideas Intended Student Learning Students should know and understand the following: Students should provide evidence that they are able to do the following: Written reports should state what was done and why, the results, the analysis and interpretation of the results, and the conclusions drawn from the results. Sufficient information should be included to enable the procedure to be repeated by others. Write a report of an investigation that includes a description of its purpose and experimental procedure, results, and analysis, discussing alternative explanations and presenting conclusions. Multimedia presentations use minimal words and a variety of graphics to present information. Use concise language and graphics to present information. Mathematical Skills The International System of Units (SI System) The fundamental units in the SI system include kilogram, metre, second, and ampere. State units of quantities in SI units. Values in physics are commonly expressed in scientific notation. State values in scientific notation with appropriate prefixes. Scientific prefixes are commonly used in physics. Use the prefixes pico (1012), nano (109), micro (106), milli (103), centi (102), kilo (103), mega (106), giga (109), and tera (1012) in calculations. Convert between units for quantities such as mass, distance, time, speed, energy, and wavelength. Significant Figures The number of significant figures in the result of a calculation is determined using the following simple rules: 1. For multiplication and division, round the result of the calculation to the number of significant figures equal to the smallest number of significant figures in the given data. 2. For addition and subtraction: write all numbers to the same power of ten identify the number in the given data with the smallest number of decimal places round the result of the final calculation to the number of decimal places you have identified. Mathematical Relationships Express final numerical answers to the appropriate number of significant figures by using simple rules. Key Ideas Intended Student Learning Students should know and understand the following: Students should provide evidence that they are able to do the following: Many basic mathematical relationships and skills are used in physics in order to understand relationships between variables. Rearrange algebraic equations. Use Pythagoras’ theorem to find the length of unknown sides of a right-angled triangle. Use sine, cosine, and tangent in right-angled triangles to find unknown side-lengths and angles. Solve simple quadratic equations. Use the relationship between the circumference and the radius of a circle. Perform simple geometric calculations with equilateral and isosceles triangles. Use complementary angles to find unknown angles. Vectors Vectors and their components are useful tools for simplifying complex motions and interactions. Identify and distinguish between scalar quantities and vector quantities. Draw a representation of a vector quantity to scale. Separate a vector quantity into perpendicular components. Add and subtract vectors and vector components.


