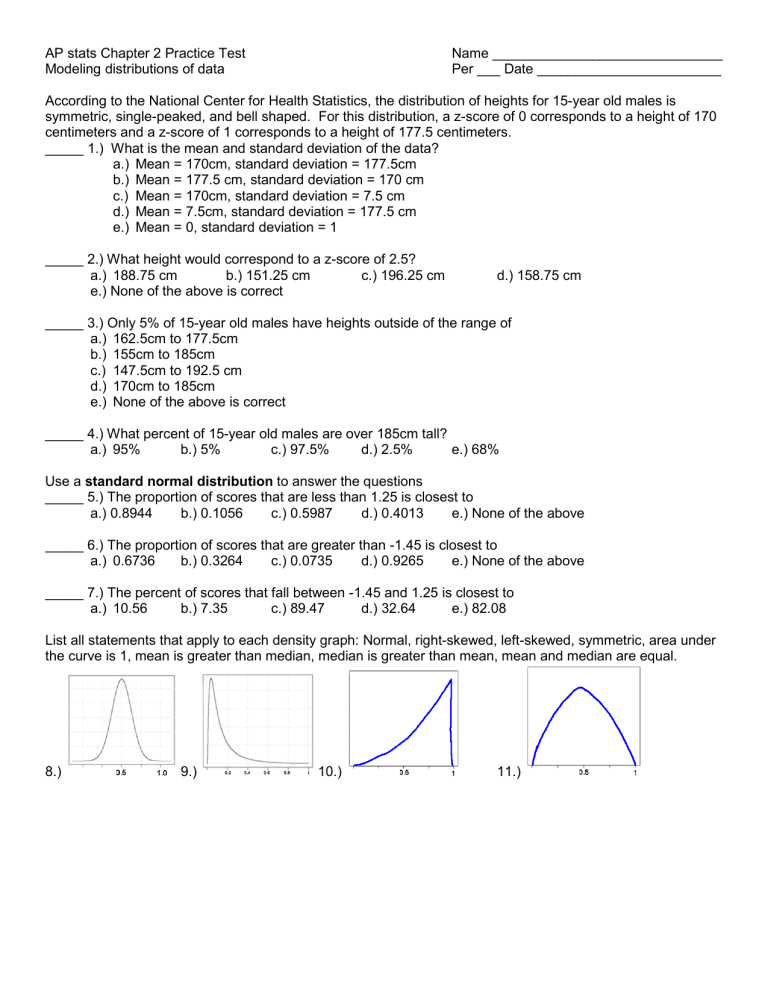
AP stats Chapter 2 Practice Test Modeling distributions of data Name ______________________________ Per ___ Date ________________________ According to the National Center for Health Statistics, the distribution of heights for 15-year old males is symmetric, single-peaked, and bell shaped. For this distribution, a z-score of 0 corresponds to a height of 170 centimeters and a z-score of 1 corresponds to a height of 177.5 centimeters. _____ 1.) What is the mean and standard deviation of the data? a.) Mean = 170cm, standard deviation = 177.5cm b.) Mean = 177.5 cm, standard deviation = 170 cm c.) Mean = 170cm, standard deviation = 7.5 cm d.) Mean = 7.5cm, standard deviation = 177.5 cm e.) Mean = 0, standard deviation = 1 _____ 2.) What height would correspond to a z-score of 2.5? a.) 188.75 cm b.) 151.25 cm c.) 196.25 cm e.) None of the above is correct d.) 158.75 cm _____ 3.) Only 5% of 15-year old males have heights outside of the range of a.) 162.5cm to 177.5cm b.) 155cm to 185cm c.) 147.5cm to 192.5 cm d.) 170cm to 185cm e.) None of the above is correct _____ 4.) What percent of 15-year old males are over 185cm tall? a.) 95% b.) 5% c.) 97.5% d.) 2.5% e.) 68% Use a standard normal distribution to answer the questions _____ 5.) The proportion of scores that are less than 1.25 is closest to a.) 0.8944 b.) 0.1056 c.) 0.5987 d.) 0.4013 e.) None of the above _____ 6.) The proportion of scores that are greater than -1.45 is closest to a.) 0.6736 b.) 0.3264 c.) 0.0735 d.) 0.9265 e.) None of the above _____ 7.) The percent of scores that fall between -1.45 and 1.25 is closest to a.) 10.56 b.) 7.35 c.) 89.47 d.) 32.64 e.) 82.08 List all statements that apply to each density graph: Normal, right-skewed, left-skewed, symmetric, area under the curve is 1, mean is greater than median, median is greater than mean, mean and median are equal. 8.) 9.) 10.) 11.) _____ 12. The graph to the right is a Normal Probability Plot for the raw scores on the chapter 1 test. Which of the statements is true about the shape of the test scores? a.) The distribution is approximately normal b.) The distribution is skewed left c.) The distribution is skewed right d.) There are no outliers e.) There is insufficient information to determine the shape of the distribution _____ 13.) The graph to the right is a Normal Probability Plot for the raw scores on the chapter 1 test. Which of the statements is true about the shape of the test scores? a.) The distribution is approximately normal b.) The distribution is skewed left c.) The distribution is skewed right d.) There are no outliers e.) There is insufficient information to determine the shape of the distribution The cumulative relative frequency graph at the left shows the distribution of how long it takes a vehicle to stop after pressing on the breaks at a certain speed. _____ 14.) The interquartile range for the distribution is a.) 12 b.) 20 c.) 32 d.) 8 e.) 25 _____ 15.) Approximately what proportion of the cars stopped in more than 10 seconds? a.) 0.85 b.) 0.15 c.) 0.30 d.) 0.70 e.) 25 _____ 16.) A group of Australian students were asked to estimate the width of their classroom in feet. The mean was 43.7ft, the standard deviation was 12.5ft, and the distribution was skewed right. The distribution of their z-scores for the width is a.) Normally distributed with a mean of 43.7 and a standard deviation of 12.5 b.) Skewed left with a mean of 43.7 and a standard deviation of 12.5 c.) Skewed right with a mean of 43.7 and a standard deviation of 12.5 d.) Normally distributed with a mean of 0 and a standard deviation of 1 e.) Skewed right with a mean of 0 and a standard deviation of 1 _____ 17.) If a distribution is symmetrical, which of the following is true? (a) The mean must be less than the median. (b) The mean and median must be equal. (c) The mean must be greater than the median. (d) The mean is either equal to or less than the median, (e) It’s impossible to tell which of the above statements is true without seeing the data. _____ 18.) If a distribution is skewed to the right, which of the following is true? (a) The mean must be less than the median. (b) The mean and median must be equal. (c) The mean must be greater than the median. (d) The mean is either equal to or less than the median, (e) It’s impossible to tell which of the above statements is true without seeing the data. _____ 19.) If a distribution is skewed to the left, which of the following is true? (a) The mean must be less than the median. (b) The mean and median must be equal. (c) The mean must be greater than the median. (d) The mean is either equal to or less than the median, (e) It’s impossible to tell which of the above statements is true without seeing the data. _____ 20.) The mean mercury concentration in sampled cans of tuna is 0.285 ppm with a standard deviation of 0.300ppm. Which of the following is a correct interpretation of standard deviation? (a) The mean amount of mercury in all other cans of tuna will be within 0.300 ppm of the mean. (b) All cans of tuna have between 0 and 0.585 ppm of mercury in them. (c) About half the cans of tuna have between 0 and 0.585 ppm of mercury in them (d) The difference in the mean and the median amount of mercury is 0.300 ppm (e) The distance between the ppm of mercury in each can and the mean ppm is, on average, about 0.300ppm _____ 21.) A survey was designed to study how business operations vary according to their size. Companies were classified as small, medium, or large. Questionnaires were sent to 200 randomly selected businesses of each size. Since not all questionnaires in a survey of this type are returned , researchers decided to investigate the relationship between the response rate and the size of the business. The data is shown in the table below: Size Response No Response Total Small 125 75 200 Medium 81 119 200 Large 40 160 200 Which of the following conclusions seems to be supported by the data? (a) There are more small companies than large companies in the survey. (b) Small companies appear to have a higher response rate than medium or big companies. (c) Exactly the same number of companies responded as didn’t respond. (d) Small companies dislike larger companies (e) If we combine the medium and large companies, then their response rate would be equal to that of the small companies. _____ 22. If a distribution is symmetrical, which of the following is true? (a) The mean must be less than the median. (b) The mean and median must be equal. (c) The mean must be greater than the median. (d) The mean is either equal to or less than the median, (e) It’s impossible to tell which of the above statements is true without seeing the data. _____ 23. If a distribution is skewed to the right, which of the following is true? (a) The mean must be less than the median. (b) The mean and median must be equal. (c) The mean must be greater than the median. (d) The mean is either equal to or less than the median, (e) It’s impossible to tell which of the above statements is true without seeing the data. _____ 24. If a distribution is skewed to the left, which of the following is true? (a) The mean must be less than the median. (b) The mean and median must be equal. (c) The mean must be greater than the median. (d) The mean is either equal to or less than the median, (e) It’s impossible to tell which of the above statements is true without seeing the data. 25.) The Presidential Physical Fitness Program gives awards to those who meet qualifying standards in five events. The standards are based on the 1985 School Population Fitness Survey. For the National Award, the standard is the 50th percentile for a specific age group and gender. Jane, who is 9 years old, did 40 curl-ups in one minute. Matt, who is 12 years old, also did 40 curl-ups in one minute. The standard for the National Award are 30 curl-ups for Jane and 35 curl-ups for Matt. The standard deviation is 10 and 8 curl-ups respectively. The distributions are approximately normal. a.) How do Jane’s and Matt’s performances compare? Provide appropriate statistical calculations to support your answer. b.) Estimate the number of 9-year old girls that could do more than 40 curl-ups, if 250 girls participated in the program. c.) Estimate the 90th percentile for 12-year old boys. 26.) Rainwater was collected in water collectors at 30 different sites near an industrial complex, and the amount of acidity (pH level) was measured. The mean and standard deviation of the values are 4.60 and 1.10, respectively. When the pH meter was recalibrated back at the laboratory, it was found to be in error. The error can be corrected by adding 0.1 pH units to all of the values and then multiplying the result by 1.2. What is the new mean and standard deviation? Show all your work and explain your reasoning. 27.) Until the scale was changed in 1995, SAT scores were based on a scale set many years ago. For Math scores, the mean under the old scale was 470 and the standard deviation was 110. In 2009, the mean was 515 and the standard deviation was 116. a.) What is the standardized score for a student who scored 500 on the old scale? b.) Jane took the SAT in 1994 and scored 500. Colleen took the SAT in 2009 and scored 530. Compare their scores. Provide appropriate statistical calculations to support your answer. c.) The distributions for the tests are approximately normal. Find the 75th percentile for both tests. d.) The distributions for the tests are approximately normal. What percentage of students scored above 800 on both tests? 28.) Does party affiliation differ among the genders? A review of voter registration in a small town yielded the following table of the number of males and females registered for each party Party Affiliation Democrat Republican Other Total Male 300 500 200 1000 Female 600 300 100 1000 Total 900 800 300 2000 a.) Calculate the conditional distributions for party affiliation among each gender. You may present your results in either a table or a graph. b.) Discuss the relationship between gender and party affiliation in two or three sentences.


