7th Grade Math Quiz: Central Tendency (Mean, Median, Mode)
advertisement

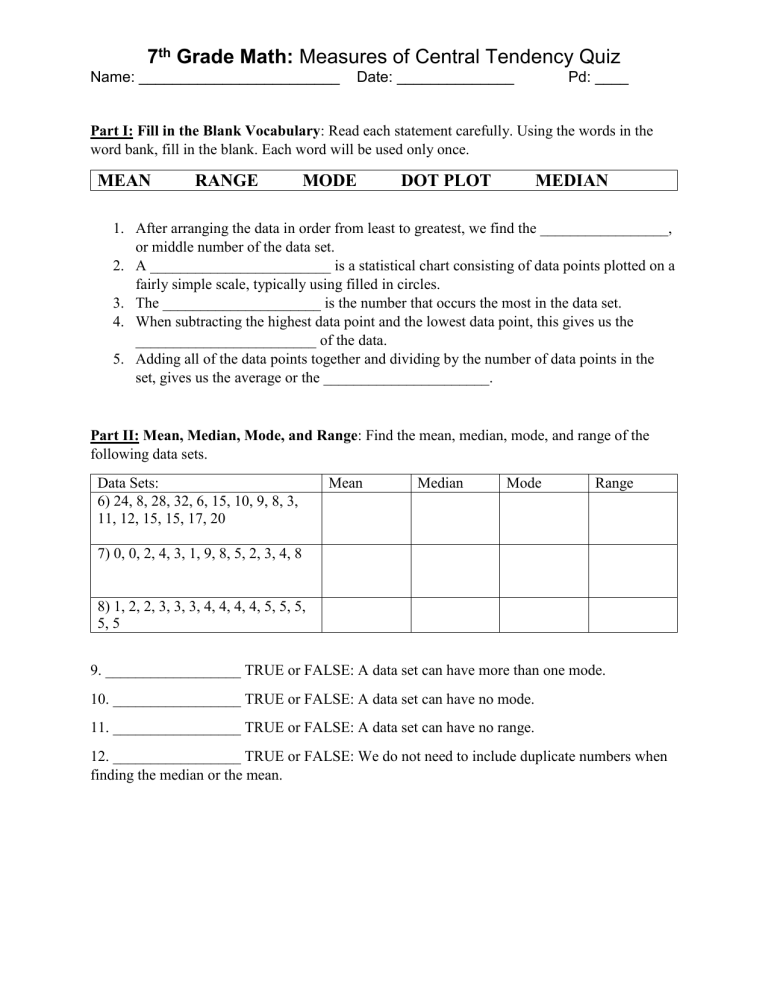
7th Grade Math: Measures of Central Tendency Quiz Name: ________________________ Date: ______________ Pd: ____ Part I: Fill in the Blank Vocabulary: Read each statement carefully. Using the words in the word bank, fill in the blank. Each word will be used only once. MEAN RANGE MODE DOT PLOT MEDIAN 1. After arranging the data in order from least to greatest, we find the _________________, or middle number of the data set. 2. A ________________________ is a statistical chart consisting of data points plotted on a fairly simple scale, typically using filled in circles. 3. The _____________________ is the number that occurs the most in the data set. 4. When subtracting the highest data point and the lowest data point, this gives us the ________________________ of the data. 5. Adding all of the data points together and dividing by the number of data points in the set, gives us the average or the ______________________. Part II: Mean, Median, Mode, and Range: Find the mean, median, mode, and range of the following data sets. Data Sets: 6) 24, 8, 28, 32, 6, 15, 10, 9, 8, 3, 11, 12, 15, 15, 17, 20 Mean Median Mode Range 7) 0, 0, 2, 4, 3, 1, 9, 8, 5, 2, 3, 4, 8 8) 1, 2, 2, 3, 3, 3, 4, 4, 4, 4, 5, 5, 5, 5, 5 9. __________________ TRUE or FALSE: A data set can have more than one mode. 10. _________________ TRUE or FALSE: A data set can have no mode. 11. _________________ TRUE or FALSE: A data set can have no range. 12. _________________ TRUE or FALSE: We do not need to include duplicate numbers when finding the median or the mean. 7th Grade Math: Measures of Central Tendency Quiz Name: ________________________ Date: ______________ Pd: ____ Part III: Inferencing Data using Dot Plots: Using the dot plot provided, answer the questions. Mean: Mode: Median: Range: Mean: Mode: Median: Range: Mean: Mode: Median: Range:


