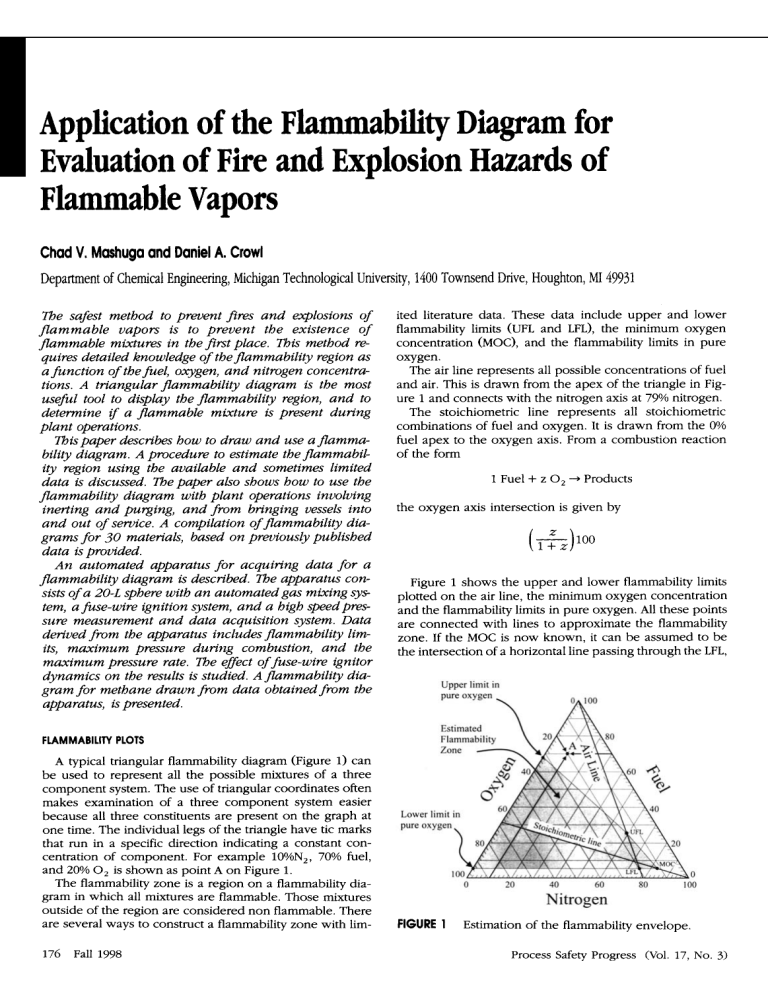
Application of the Flammability Diagram for Evaluation of Fire and Explosion Hazards of Flammable Vapors Chad V. Mashuga and Daniel A. Crow1 Department of Chemical Engineering, Michigan Technological University, 1400 Townsend Drive, Houghton, MI 49931 The safest method to prevent fires and explosions of flammable vapors is to prevent the existence of flammable mixtures in the first place. This method requires detailed knowledge of theflammability region as a function of thefuel, oxygen, and nitrogen concentrations. A triangular flammability diagram is the most useful tool to display the flammability region, and to determine if a flammable mixture is present during plant operations. Thispaper describes how to draw and use aflammability diagram. A procedure to estimate theflammability region using the available and sometimes limited data is discussed. The paper also shows how to use the flammability diagram with plant operations involving inerting and pulging, and from bringing vessels into and out of service. A compilation offlammability diag r a m for 30 materials, based on previously published data is provided. An automated apparatus for acquiring data for a flammability diagram is described. 7%eapparatus consists of a 20-L sphere with an automated gas mixing sy* tem, a fuse-wire ignition system, and a high speedpressure measurement and data acquisition system. Data derived from the apparatus includes flammability limits, maximum pressure during combustion, and the maximum pressure rate. m e effect of fuse-wire ignitor dynamics on the results is studied. A flammability diagram for methane drawn from data obtained from the apparatus, is presented. ited literature data. These data include upper and lower flammability limits (UFL and LFL), the minimum oxygen concentration (MOC), and the flammability limits in pure oxygen. The air line represents all possible concentrations of fuel and air. This is drawn from the apex of the triangle in Figure 1 and connects with the nitrogen axis at 79% nitrogen. The stoichiometric line represents all stoichiometric combinations of fuel and oxygen. It is drawn from the 0% fuel apex to the oxygen axis. From a combustion reaction of the form 1 Fuel + z 0, -+Products the oxygen axis intersection is given by Figure 1 shows the upper and lower flammability limits plotted on the air line, the minimum oxygen concentration and the flammability limits in pure oxygen. All these points are connected with lines to approximate the flammability zone. If the MOC is now known, it can be assumed to be the intersection of a horizontal line passing through the LFL, Upper limit in pure oxygen FLAMMABILITY PLOTS A typical triangular flammability diagram (Figure 1) can be used to represent all the possible mixtures of a three component system. The use of triangular coordinates often makes examination of a three component system easier because all three constituents are present on the graph at one time. The individual legs of the triangle have tic marks that run in a specific direction indicating a constant concentration of component. For example 10%N,, 70% fuel, and 20% 0, is shown as point A on Figure 1. The flammability zone is a region on a flammability diagram in which all mixtures are flammable. Those mixtures outside of the region are considered non flammable. There are several ways to construct a flammability zone with lim176 Fall 1998 Lower limit m 0 0 20 40 60 80 100 Nitrogen FIGURE 1 Estimation of the flammability envelope Process Safety Progress (Vol. 17, No. 3) and intersecting the stoichiometric line. With the assumed MOC, LFL and UFL an estimated flammability zone is constructed. The straight line approximation from the limits of flammability in air and pure oxygen represent an estimated flammability zone. The actual zone will have some curvature, especially in the upper flammability limit region. The actual flammability zones should be used whenever possible. The nose of the flammability zone, from the air line to the MOC is most important. If the flammabilitylimits in pure oxygen are not known, then the nose region is approximated using the LFL, UFL and MOC. Once the flammability zone is defined, it can be utilized to prevent flammable mixtures. The following examples demonstrate the utility of the triangular flammability diagrams. Scenario I substance can be added if the oxygen concentration in the tank is lowered to a certain level. The question is what is a safe level of oxygen? This level is called the In Service Oxygen Concentration (ISOC). The ISOC is found by projecting a vector from the apex of the flammability diagram, through the MOC and onto the nitrogen scale. The ISOC is found by taking 100 minus this intercept value. Figure 2 shows the ISOC vector and the intercept on the nitrogen scale of 88%for this case. The ISOC is then 100%- 88%= 12% oxygen. The graphical solution in Figure 2 for the previous scenarios demonstrates visually the utility of the triangular representation. From the geometry of the previous examples, several equations can be developed. Figures 3 and 4 summarize Scenario 1 and 2. If the MOC is not known, it can be estimated from MOC = (z) (LFL) and placed into the equations. LITERATURE DATA A vessel containing a flammable liquid, such as propane, must be taken out of service. The vessel is drained of liquid and depressurized to atmospheric conditions. Under these conditions the vessel contains 100% fuel, represented by the 100% fuel apex on Figure 2. If air is introduced to the vessel, the vapor concentration follows the air line from the apex, through the flammability zone to the nitrogen axis. Clearly, a flammable mixture exists at some point in this operation presenting a safety hazard. The solution is to dilute the contained fuel vapor with an inert. This is equivalent to following the fuel axis from the 100% fuel apex towards the 100% nitrogen apex. A point is reached, called the Out of Service Fuel Concentration (OSFC), where air can now be introduced and the flammability zone avoided. The OSFC is found by drawing a vector from the intercept of the air line and the nitrogen scale, through the MOC and onto the fuel scale. The OSFC vector can be seen in Figure 2 and has the value of 12% fuel for this case. Literature sources of flammabilitydiagrams are limited in quantity and vary in quality. A compilation of diagrams for 30 materials has been assembled. Due to space limitations, only methane is presented in the appendix. The other chemicals listed in Table 1 can be viewed or downloaded at “www.chem.mtu.edu/ cvmashug/LPS.html.” Data for the preceding triangular graphs was obtained by scanning the original literature figure with a scanner, digitizing the points, converting them to proper coordinates, and plotting them. ASCII data generated was then imported into a spreadsheet and converted from air/fuel data to percentage nitrogen, oxygen, and fuel. The conversion to a triangular plot was made by employing trigonometric relationships and scaling factors. The section of the spreadsheet that contains the converted data was then exported as an ASCII File. N Air Scenario 2 An empty tank contains air, and it is desired to add a flammable substance to the tank for storage. The flammable Flammable Vapor MOC OsFCMOC Nitrogen FIGURE 2 Determination of the ISOC and OSFC Process Safety Progress (Vol. 17, No. 3) FIGURE 3 Scenario 1: Tank with residual fuel vapors needing service. Fall 1998 177 Flammable Material 1 I I Air FLAMMABILITY APPARATUS U MOC * z )::-.( FIGURE 4 The triangular graphs were drawn using Designcad. This program will convert ASCII data files to curves or points. The ASCII data was converted to points and curves and layered on top of the pre drawn triangle plots. The plots were then imported into Core1 Draw for final vector projection and property information display. Table 1 is a directory of triangle plots. It contains a summary of flammability information. Scenario 2: Tank being placed into flammable storage service. The remainder of this paper discusses a flammability apparatus used to acquire the data necessary to define the complete flammability zone in a triangular flammability diagram. There are several design constraints on such an apparatus. First, the apparatus must be at least 20-liters in volume to reduce quenching effects from the surface. Second, the apparatus must be highly automated since several hundred attempted explosions are required to provide adequate resolution of the flammability zone. Third, the control system must be capable of automatically mixing the gas mixtures desired for the test. Fourth, the data acquisition system must be capable of tracking the very fast pressuretime history of the explosion. Finally, the apparatus must have the capability of storing large amounts of data and have a system for loading and unloading new ignitors quickly and easily. Also temperatures must be measured through a reliable thermocouple assembly. TABLE 1. Flammability Summary and Index Chemical Molecular Boiling Point UFL LFL MOC Flash Point OSFC ISOC V% fuel in air V% fuel in air V% oxygen "C From tri-plot From tri-plot Weight "C Methane 16.04 Ethane 30.07 Propane 44.1 Butane 58.12 n-Pentane 72.2 n-Hexane 86.2 Natural GasEthylene 2805 Propylene 42.1 2-Methylpropene 56.11 1-Butene 56.11 3-Methyl Butene 70.14 1J-Butadiene 54.09 Acetylene 26.04 Benzene 78.11 Methyl Alcohol 32.04 Ethyl Alcohol 46.07 2-Ethylbutanol Dimethyl Ether 46.07 Diethyl Ether 74.12 Isobutyl Formate 102.13 Methyl Acetate 74.08 Methyl Ethyl Ketone72.11 Carbon Disulfide 76.13 Gasoline (115/145) JP-4 Hydrogen 2.016 Carbon monoxide 28.01 - 161.45 - 88.65 -42.1 - 0.45 36.1 68.8 13.9 - 103.75 - 47.75 - 6.85 - 6.25 20.15 - 4.45 - 83.95 80.15 64.7 78.4 - - 24.9 34.6 98.5 57 79.7 46.3 - - 252.75 - 191.45 14.9 12.45 9.5 8.4 7.6 7.4 4.5 35.4 10.2 9 9.8 9.1 11.6 80 7.1 36.3 18.7 56.8 26 36 8.9 15.9 11.2 48.4 7.1 8.1 74 71.6 5 3 2.1 1.8 1.3 1.2 12 2.8 2.4 1.8 1.6 1.5 2 2.6 1.4 6.6 3.5 1.2 3.3 1.8 2 3.1 2 1.1 1.3 1.3 4.2 12.2 12 11.2 11.6 - 222.56 - 135 - 104.44 12.3 11.8 11.8 -74.15 - 49.44 - 26 11 9.9 11.5 12 11 11.5 10.5 - 136.11 - 107.78 - -76.11 - 80 - 56.67 -76.11 - 14.5 7 6.2 5.8 4.2 3.8 12.8 6 6 5.5 4.8 4 4.9 4 3.7 15 9.5 13 11.7 12 12.5 12 12.2 10.5 12 12.5 11.7 11.5 10.8 7 11.8 10.8 11 6.2 11.5 - 12.22 9.9 10.5 11 12 - - 10.5 10.2 12.5 11 11 -41.11 - 49 10 7.1 3.8 - 15 8.5 5.3 2.5 3.8 3.5 5 19.5 11 11 12.7 11.7 11.5 - 5 11.6 11.5 4 2.9 - - 8.89 - 33.9 - 6.5 6 12 11.7 5.7 7 ~~~ 178 Fall 1998 Process Safety Progress (Vol. 17, No. 3) data is collected using a National Instruments AT-MIO-16X high resolution 1/0 board capable of sampling a single channel at a rate of 200 kHz with a 16-bit A to D converter. DATA -3 FIGURE 5 I Automated flammability apparatus. Figure 5 is a flow diagram for the apparatus. The 20 liter flammability vessel was obtained from the Fike Corporation. It is constructed of 1/4 inch stainless steel with a of 300 psi. The reactor opens in a clam shell fashion for easy cleaning and access to internals. The apparatus is controlled by an interactive LabVIEW computer program which requires a number of operator specified values. These include fuel name, target gas percentages, purging requirements, and a number of data acquisition parameters used for tracking pressure and temperature as a function of time after an ignition. Once these values are entered the computer program controls the apparatus in a semi-automatic fashion. The apparatus has two pressure transducers - a 0.05% precision 25 psia pressure gauge for mixing the gases, and a 300 psi pressure gauge for following the pressure - time history of the explosion. The gases are mixed from compressed gas tanks through a manifold using a number of solenoid valves. A vacuum pump is used to evacuate both the gas manifold and vessel to 0.3 psia while inerting. A number of tests were completed to confirm the gas mixing capability of the control system. Gas samples were withdrawn from the sphere after mixing and sent out for analysis. The results show a maximum deviation of 0.16 mole percent. The vessel is first purged and evacuated several times with nitrogen to remove all the oxygen and water vapor from the system. Next, the desired gas concentrations are converted to partial pressures and loaded into the vessel using feedback control from a pressure transducer. The pressure transducer for the gas mixing is a high resolution Sensotec with 0.05% accuracy and a maximum pressure of 25 psia. Fast response solenoid valves are used to accomplish the gas loading. Once the gases are loaded, a magnetically driven stirrer ensures a homogeneous mixture. There is a delay after the mixer has stopped to allow any turbulence and temperature transients to dissipate. Ignition of the mixture is accomplished by the vaporization of a 1.0 cm, 40 gauge wire with a 500VA isolation transformer in accordance with ASTM E 918-83El. The ignition wire is loaded into the reactor center by a quick connector arrangement. A new fuse wire can be loaded in about a minute. An extension made of thermocouple ceramic has a low profile to the impending flame front, and places the igniter in the center of the reactor. A bank of 10 igniter assemblies have been fabricated for consecutive experimentation. A second Sensotec pressure transducer (TJE) is used for tracking the pressure as a function of time after ignition. The Process Safety Progress (Vol. 17, No. 3) The data acquisition system records the pressure and temperature of the exploding gases as a function of time. These data are used by the software to determine 1) the maximum pressure during the explosion, and 2) the maximum rate of pressure increase. The maximum rate of pressure increase is found by selecting a narrow range in the pressure history containing [dP/dt],, . This data is then fitted with LabVIEW to a high order polynomial. The differential of this polynomial is used to determine the maximum rate of pressure rise. This maximum rate of pressure increase is used to determine the deflagration index K, = [dP/dt],, V 'I3. IGNITER DYNAMICS This work included an extensive study of the behavior of fuse wire igniter dynamics: first, to determine the energy delivered from a fuse wire assembly, and second, to determine the effect of fuse wire energy on the deflagration index, K,, and the maximum combustion pressure. The fuse wire igniter energy was measured using a Tektronix 2211 digital oscilloscope, displayed in the circuit in Figure 6. The 1.0 SZ resistor was used to measure the current and direct measurements across the fuse wire allowed determination of the voltage history during ignitor electrification. The initial igniter system consisted of a 500VA isolation transformer with an instant on ( + / - lms) solid state relay connected to the transformer's output. The relay's fast response can be traced back to its solid state construction which allows it to switch anywhere in the AC cycle. Figure 7 shows the current and voltage as a function of time for two identical experiments. Power is the product of voltage and current at each time instant. The integration of this product or area under the power curve is the total energy delivered to the wire. Figure 8 shows the power for the two experiments. The areas under the power curve also differ significantly, demonstrating that the power delivery to the igniter using this config- Isolation Transformer 500VA 2 > Adpslahle - 0 I I I I I I I I I I -I =k Voltage energy testing circuit. Fall 1998 179 I I Instant-On Relay 801 -Trial 70 I 160 140 A Cunent Zero Switching Relay I 80 I I I 7n I" 1 C Current Trial D Current ......Trld c Voltage Trial D Voltage -Trial 30 160 I40 120 I00 80 60 z5 = 40 10 I I Time (ms) FIGURE 7 20 0 Voltage and current delivery to the igniter with an instant-on solid state relay. 0 1 2 4 5 6 7 8 9 Time (ms) FIGURE 9 Voltage and current delivery to igniter with zero crossing solid state relay. Power and Energy Delivery -Trial 3 Power and Energy Delivery A Power Trial B Power 0 I 2 3 4 s 6 1 0 1 2 3 Time (ms) FIGURE 8 Power and energy delivery to the igniter with an instant-on solid state relay. uration is highly variable, depending on where the relay triggers on the AC cycle. To remedy this problem the instant-on relay was replaced with a relay which always switches at the zero crossing point in the AC cycle (Potter and Brumfield, SSR240D25). Figure 9 shows the same experiment of Figure 7 repeated with the zero crossing relay. Figure 9 shows the voltage and current as a function of time. Figure 10 shows the power delivery. The results show that the energy delivered to the igniter using the zero crossing relay is repeatable. To determine the effect of igniter energy on K,, known variations in energy are needed. To accomplish this the resistance of the igniter circuit was changed and the resulting energy and power delivery are measured. Figure 11 shows this variation in energy as a function of the selected resistance. Several experiments at each resistance were conducted and the associated error bars are attached in Figure 11. A study of igniter energy effects on K, was performed. Experiments were conducted along the air line with methane. The initial pressure was 1 atmosphere and the initial temperature was 25°C. Figure 12 shows the result of igniter energy variations from 5.4 to 14.7 J and its effect on K,. From Figure 12 several conclusions can be drawn. The first is that the K, does not vary with the igniter energy for the range of energies examined. It was decided to use a lOJ ignitor for further studies. This energy was chosen be180 Fall 1998 4 5 6 7 8 Time (ms) FIGURE 10 Power and energy delivery to igniter with zero crossing solid state relay. Adjustable Ignition Energy 14 I I 2 7 0 05 10 15 20 25 30 15 Resistance (ohms) FIGURE 1 1 Ignition energy and resistor selection. cause it produced very little spattering of the igniter wire and is above the 5 J/cm needed to produce a cylindrical shock wave upon wire vaporization The second observation is the relative maximum of K, appears to be about 7 4 bar-m/sec. Reported values include 64 bar-m/sec in NFPA 68D1, and 55 bar-m/sec from Bartchnekt [8]. [a. EFFECT OF HUMIDITY ON K G Values reported in the literature for K, are those of a maximum value along the air line. An examination of the Process safety Progress 0'01. 17, NO. 3) mum of 19.5% oxygen and an upper limit of 23.5%. The next experiment was conducted with synthesized air produced by the automated apparatus. This is air made from pure oxygen and nitrogen sources without the presence of water vapor or argon. This experiment produced slightly smaller values of K, than the compressed air cylinder. Thus, variability can be introduced by using different commercial sources of compressed air. The next experiment was to examine the effect of humidity on the K, values. A constant methane percentage of 9.7% was maintained while increasing the humidity. Figure 14 shows how the humidity has an effect on the K, values observed. A closer examination of the role of humidity on the K, values can be seen from Figure 15. From Figure 15 it can be concluded that K, values can change significantlybased on the humidity from the air source. The largest K, value for methane is obtained with dry air. K, and Ignition Energy . n F=14 71 V a2 Y) 'f 50 1 o E=9 91 I! a e E=5 41 '0 0 0 5 6 7 8 10 9 I2 11 13 15 14 16 Methane Volume YOin Air FIGURE 12 The effect of ignition energy on K,. Effect of Inert on Stoichiometric Methane Combustion 250 I NEW METHANE DATA New data for methane has been generated using the automated flammability apparatus. These data include maximum pressure of combustion, a more detailed flammability zone and new K, data. Figure 16 compares maximum pressure in air to other literature sources, the maximum pressure is to the right of the stoichiometric ratio and occurs around 10% methane. This 55 65 60 80 75 70 90 85 YONitrogen FIGURE 13 Sensitivity of K, to variations in inert along the stoichiometric line. Kc and Humidity 9 11% Meihanr Methane and 'Air' n 90 80 I - I A Dry Cornprersed Air 0 Synthesized 41r 0 +Humidified - a 5 40 u x 30 20 - C'ornprersed Air 50 0 ' 10 0 0 20 30 40 60 50 70 80 90 100 YORelative Humidity 0 10 0 0 5 n ' i ' ' ' 6 7 8 9 10 II ' ' 12 Q 13 14 = ' 15 16 FIGURE 15 Sensitivity of K, to relative humidity 17 Methane Volume YOin 'Air' Maximum Ignition Pressure FIGURE 14 Sensitivity to K, to variations in air sources and humidity. 140 I 120 - .-a h sensitivity of this maximum to small changes in inert is shown in Figure 13. These data were obtained in our 20 liter apparatus. This Figure shows the large slope of K, values as a function of the position along the stoichiometric line. In Figure 13 a 1% change in nitrogen causes a change of 12 bar-m/sec. Thus, small changes in inert can cause large variation in K,. Figure 14 shows identical experiments conducted with various sources of air. The highest K, values are attained with a cylinder of compressed air. Unless otherwise specified, some manufacturers of compressed air allow a miniProcess Safety Progress (Vol. 17, No. 3) 100 - 5 80 $ 60 a - 40 g - 20 - 21 ; z 8. .MTb "Kuchta ~ . % ' 0 '0 a t.a 0 " " " " " " " " 2 3 4 5 6 7 8 9 I0 1 1 12 13 14 15 16 17 I8 Methane Volume % in Air FIGURE 16 Maximum pressure of ignition for methane along the air line. Fall 1998 181 Flammability zone data on 30 materials from existing literature sources has been assembled for convenient use. A fuse wire igniter system is capable of delivering a consistent power delivery if a solid state relay is used that triggers at the AC cycle crossing. We used lOJ to the fuse wire to reduce wire spattering. K, for methane is not affected by changes in ignition energy (5 to 15J). K, values for methane are very sensitive to humidity and the type of ‘air’used. Pma data for this apparatus compares well to several other sources. Data has been obtained for methane to provide much more detail to the flammability zone. 0,100 RECOMMENDATION Nitrogen Currently no standard procedure exists for determining FIGURE 17 Flammability diagram for methane. K, values for gases. This study has clearly shown the sensitivity of K, to small changes in experimental procedure and the variability in literature values. A standard proce- dure is essential to continued experimental characterization in this area. Methane and ‘Air’ FUTURE WORK .** , 13 14 D 5 6 7 8 9 10 I/ 12 Future work will include further definition of the methane flammability zone. We also plan to look at gas mixtures and to evaluate modeling techniques to predict the flammability zone. -4 IS 16 Methane Volume YOin ‘Air‘ FIGURE 18 K, for methane along the air line. figure also shows an interesting non-symmetrical shift a about 13% methane where other sources of data end. An older flammability zone for methane can be seen in the appendix. Figure 17 shows our existing data: each open circle indicates a non flammable mixture, where a solid circle denotes a flammable.A mixture is defined as flammable if the pressure increase is greater than 7% of the ambient according to ASTM E 918-83El. Each of the flammable tests contain other information such as P-, K,, maximum temperature and others. Figure 18 shows our K, data for methane along the air line. The maximum K, occurs just to the right of stoichiometric, around 10%methane, with a value of 74 bar-m/sec. SUMMARY AND CONCLUSIONS A triangular flammability diagram is useful for avoiding flammable mixtures during plant operations involving flammable materials. A flammability zone can be approximated using lim ited data. However, actual data is always recommended. 182 Fall 1998 ACKNOWLEDGEMENT This work was funded by the Dow Foundation, Dow Chemical, Dow Corning, BASF, and Michigan Technological University. LITERATURE CITED 1. Lide, D. R, Editor in chief, “Handbook of Chemistry and Physics,” 71st ed., CRC Press Inc., Boston, (1991). 2. Zabetakis, M. G., “Flammability Characteristics of Combustible Gases and Vapors,” US. Dept. of the Interior, Burea of Mines, No. 627, (1965). 3. Stephenson, R M., “Flash Points of Organic and Organometallic Compounds,” Elsevier Science Publishing Co., Inc., New York, (1987). 4. Reid, R. C., Prausnitz, J. M., and Sherwood, T. R, ‘The Properties of Gases and Liquids,” 3rd ed. McGraw Hill, New York, (1977). 5. ASTM,ASTM E918-83, “Standard Practice for Determining Limits of Flammability of Chemicals at Elevated Temperature and Pressure,” American Society for Testing and Materials, Philadelphia, PA, (1992). 6. Bennett, F. D., “Flow Fields Produced by Exploding Wires,” Ballistic Research Laboratories, Aberdeen Proving Ground, Maryland, “Exploding Wires,” P r e ceeding of the First Conference on the Ejtploding Wire Phenomenon, Boston, Massachusetts, (April 2-3, 1959). Process Safety Progress (Vol. 17, NO. 3) 9. NFPA, “NFPA 68: Guide for Venging Deflagrations,” 7. Kuchta, Joseph M., “Fire and Explosion Manual for Aircraft Accident Investigators,” Pittsburgh Mining and Safety Research Center, U.S. Bureau of Mines, USAF Contract No. F33615-72-M-5008,(July 1973). 8. Bartknecht, Wolfgang, “Explosions, Course Prevention Protection,” Springer-Verlag, New York, (1981). This paper (5al was presented at the AICbE Spring National Meeting in Neu, Orleans, LA on March 11, 1998. APPENDIX METHANE National Fire Protection Association, Baltterymarch Park, MA, (1988 and 1994 Edition). CH4 25’C and Atmospheric Pressure CH4 + 20,- C 0 2 + 2H20 Triangular Plot Data From Reference 2 Molecular weight: Boiling point: I 16.04 - 16 1.45°C LFL:~ 5% UFL:‘ 15% MOC: 12% 0, Flash point: 3 Vapor Pressure 4 Equation: -2 22.5 6 “C 1nP = A - B T(K) + C p (mmHg) 93 to 120K A = 15.2243 B = 897.84 C = -7.16 Concentration of vapor in air at 1 atm.: **% ~~~~~ From Figure: In service Concentrations: 87% N, 13% 0, Out of service Concentrations: 14.5% Fuel 85.5% N, Nitrogen -b Process Safetv Progress (Vol. 17. NO. 3) Fall 1998 183
