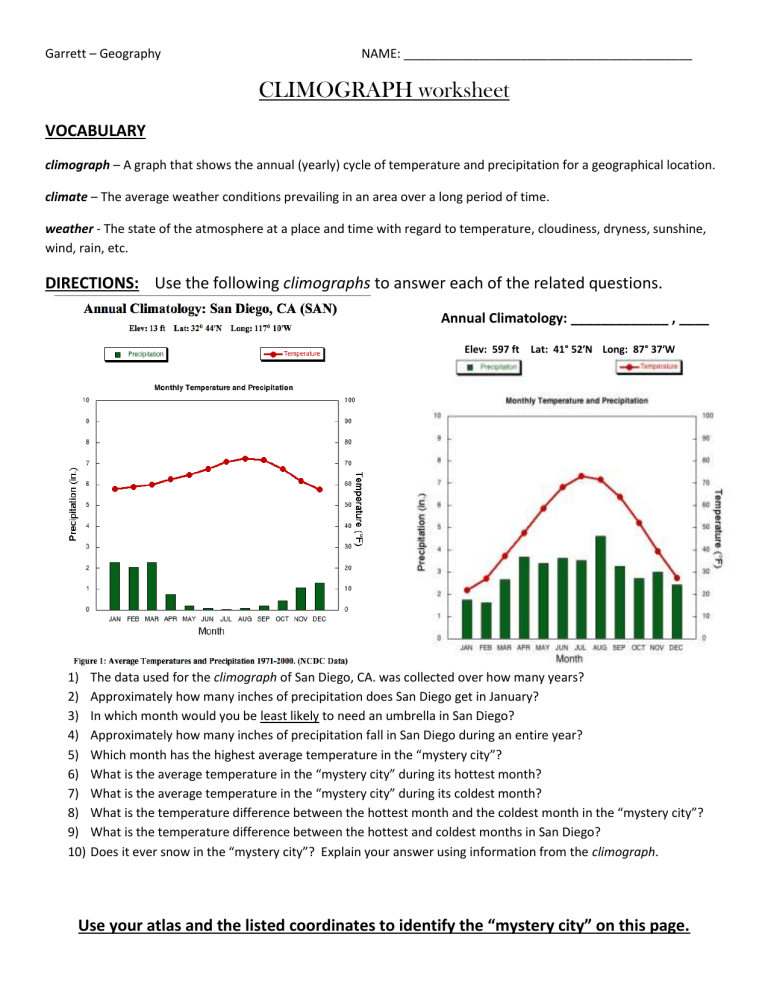
Garrett – Geography NAME: __________________________________________ CLIMOGRAPH worksheet VOCABULARY climograph – A graph that shows the annual (yearly) cycle of temperature and precipitation for a geographical location. climate – The average weather conditions prevailing in an area over a long period of time. weather - The state of the atmosphere at a place and time with regard to temperature, cloudiness, dryness, sunshine, wind, rain, etc. DIRECTIONS: Use the following climographs to answer each of the related questions. Annual Climatology: _____________ , ____ Elev: 597 ft 1) 2) 3) 4) 5) 6) 7) 8) 9) 10) Lat: 41° 52′N Long: 87° 37′W The data used for the climograph of San Diego, CA. was collected over how many years? Approximately how many inches of precipitation does San Diego get in January? In which month would you be least likely to need an umbrella in San Diego? Approximately how many inches of precipitation fall in San Diego during an entire year? Which month has the highest average temperature in the “mystery city”? What is the average temperature in the “mystery city” during its hottest month? What is the average temperature in the “mystery city” during its coldest month? What is the temperature difference between the hottest month and the coldest month in the “mystery city”? What is the temperature difference between the hottest and coldest months in San Diego? Does it ever snow in the “mystery city”? Explain your answer using information from the climograph. Use your atlas and the listed coordinates to identify the “mystery city” on this page. DIRECTIONS: Use the following climographs to answer each of the related questions Annual Climatology: _____________ , ____ Elev: 6062 ft Lat: 41°8′ N Long: 104°48′ W Annual Climatology: _____________ , ____ Elev: 48 ft Lat: 27°56′ N Long: 82°27′ W Use your atlas and the listed coordinates to identify each of these cities. 1) Which city has the most precipitation during the year? 2) How many inches of precipitation fall in this city during an average year? 3) For the city on the right, list the type of clothes would you want to have in your closet to wear anytime? 4) Explain what type of clothes would you NOT waste your money buying if you planned on living in the city on the right? 5) In which city would you expect it to rain during your 4th of July barbecue? 6) In which city would your dreams of having a “white snowy Christmas” most likely come true? 7) Explain your answer to question #6 using the information from the climograph. 8) After studying the climates of these four cities – San Diego, Chicago, Cheyenne and Tampa – explain which city you would most like to move to and the reasons why. DIRECTIONS: Use the following climographs to answer each of the related questions Use your atlas and the listed coordinates to identify each of these cities. Annual Climatology: _____________ , ____ Elev: 56 ft Lat: 58°26′ N Long: 134°13′ W 1) Explain how this climograph is different from all the others you have looked at. 2) During which months of the year could you grow a vegetable garden in this city? Annual Climatology: _____________ , _________ Elev: 5450 ft Lat: 1°17′ S Long: 36°49′ E 3) Which one of these cities has the most precipitation in the month of December? 4) Which one of these cities is in the tropics? 5) Give two (2) reasons why you know this city is in the tropics. 6) During which season (winter, spring, summer or fall) would it be the best time to plant crops in this climate? Explain your answer. CREATE YOUR OWN CLIMOGRAPH! Directions: Use the statistics on precipitation and temperature in each table to create a climograph for each city in the blank graph. Use the examples you used if you need help. Elev: 118 ft January February March April May June July August September October November December Elev: 4751 ft January February March April May June July August September October November December Lat: 32°47′ N Long: 79°56′ W Temperature Precipitation 48 degrees 51 58 65 73 78 82 81 76 67 58 51 3.5 inches 3.5 4.5 3 4 6.5 7 7 5 3 2.5 3 Lat: 38°56′ N Long: 119°44′ W Temperature Precipitation 32 degrees 37 42 47 54 63 69 68 61 50 40 32 1.5 inches 1.2 1.1 .3 .5 .4 .2 .3 .4 .6 1 1
