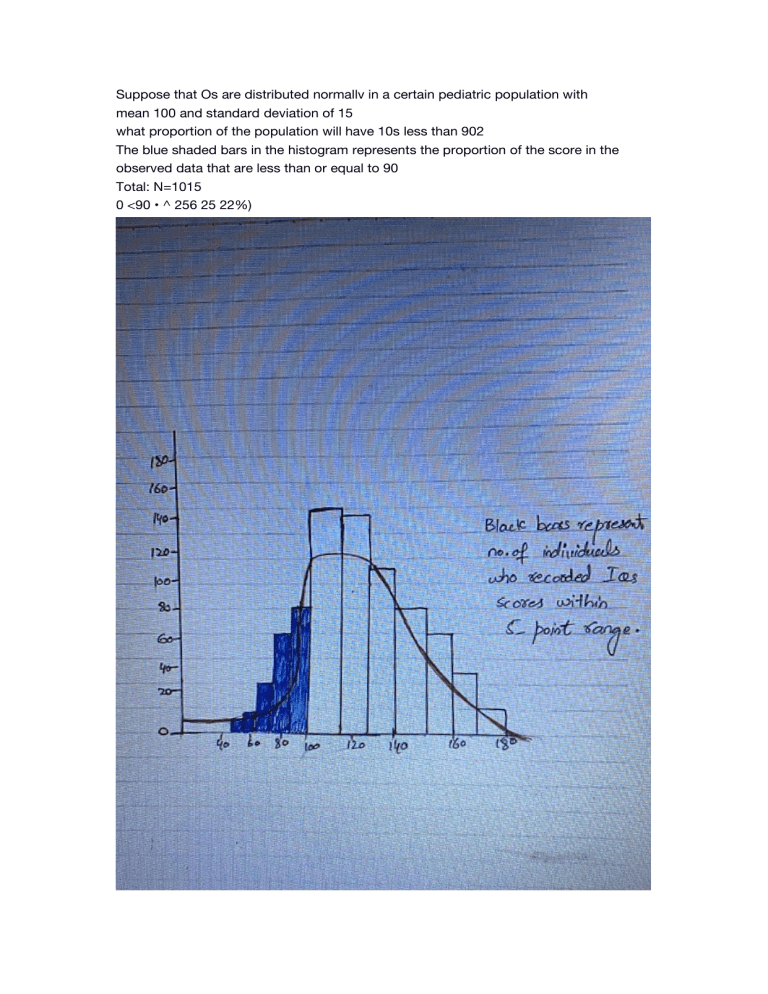
Suppose that Os are distributed normallv in a certain pediatric population with mean 100 and standard deviation of 15 what proportion of the population will have 10s less than 902 The blue shaded bars in the histogram represents the proportion of the score in the observed data that are less than or equal to 90 Total: N=1015 0 <90 • ^ 256 25 22%) what proportion will have IQs greater than 145? According to 68-95-99./ OR empirical rule. Approximately 0.3% of the proportion has IQs greater than 145 3. what is the IQ cutoff in the top 5% in this pediatric population? Z score = value - mean / Standard deviation 4. what will be the 95% reference ranges for IQs in this pediatric population? IQ scores are normally distributed with a mean of 100 and a standard deviation of 15 © About 68 % of individual have IQ score in the internal 100+-(15) = [85, 115 ] ©About 95% of individual have IQ score in the interval 100 +-2(15) =[70.1301 ©About 99.7% of the individual have IQ score in the interval 100+-3(15) =[55,1451.


