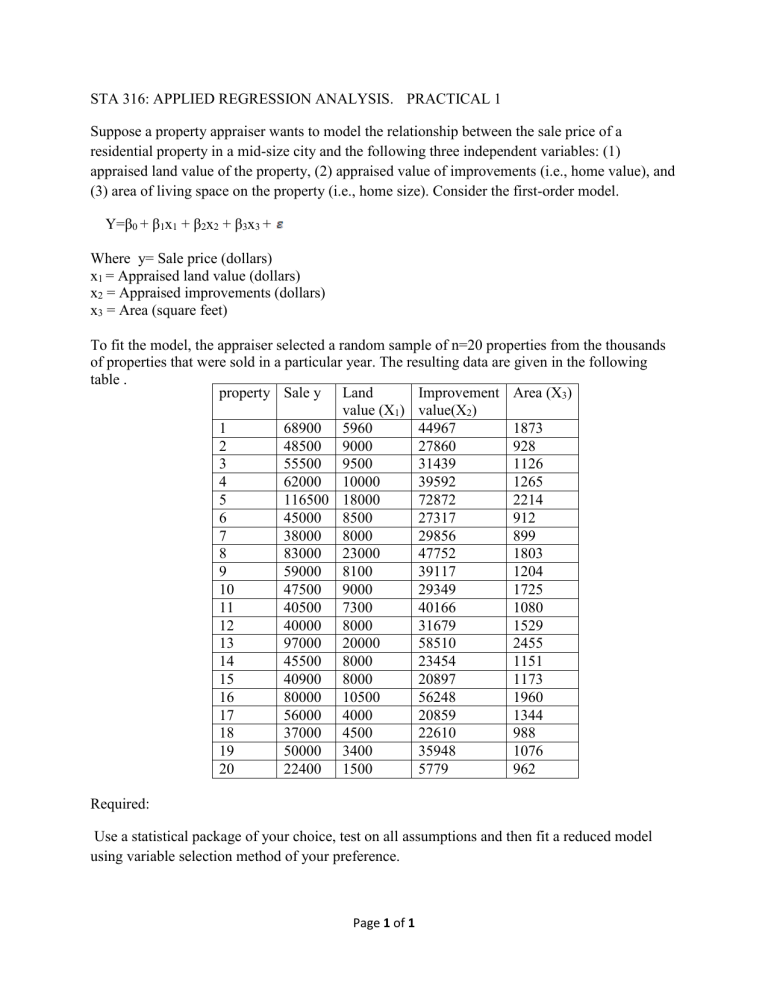
STA 316: APPLIED REGRESSION ANALYSIS. PRACTICAL 1 Suppose a property appraiser wants to model the relationship between the sale price of a residential property in a mid-size city and the following three independent variables: (1) appraised land value of the property, (2) appraised value of improvements (i.e., home value), and (3) area of living space on the property (i.e., home size). Consider the first-order model. Y=β0 + β1x1 + β2x2 + β3x3 + Where y= Sale price (dollars) x1 = Appraised land value (dollars) x2 = Appraised improvements (dollars) x3 = Area (square feet) To fit the model, the appraiser selected a random sample of n=20 properties from the thousands of properties that were sold in a particular year. The resulting data are given in the following table . property Sale y Land Improvement Area (X3) value (X1) value(X2) 1 68900 5960 44967 1873 2 48500 9000 27860 928 3 55500 9500 31439 1126 4 62000 10000 39592 1265 5 116500 18000 72872 2214 6 45000 8500 27317 912 7 38000 8000 29856 899 8 83000 23000 47752 1803 9 59000 8100 39117 1204 10 47500 9000 29349 1725 11 40500 7300 40166 1080 12 40000 8000 31679 1529 13 97000 20000 58510 2455 14 45500 8000 23454 1151 15 40900 8000 20897 1173 16 80000 10500 56248 1960 17 56000 4000 20859 1344 18 37000 4500 22610 988 19 50000 3400 35948 1076 20 22400 1500 5779 962 Required: Use a statistical package of your choice, test on all assumptions and then fit a reduced model using variable selection method of your preference. Page 1 of 1
