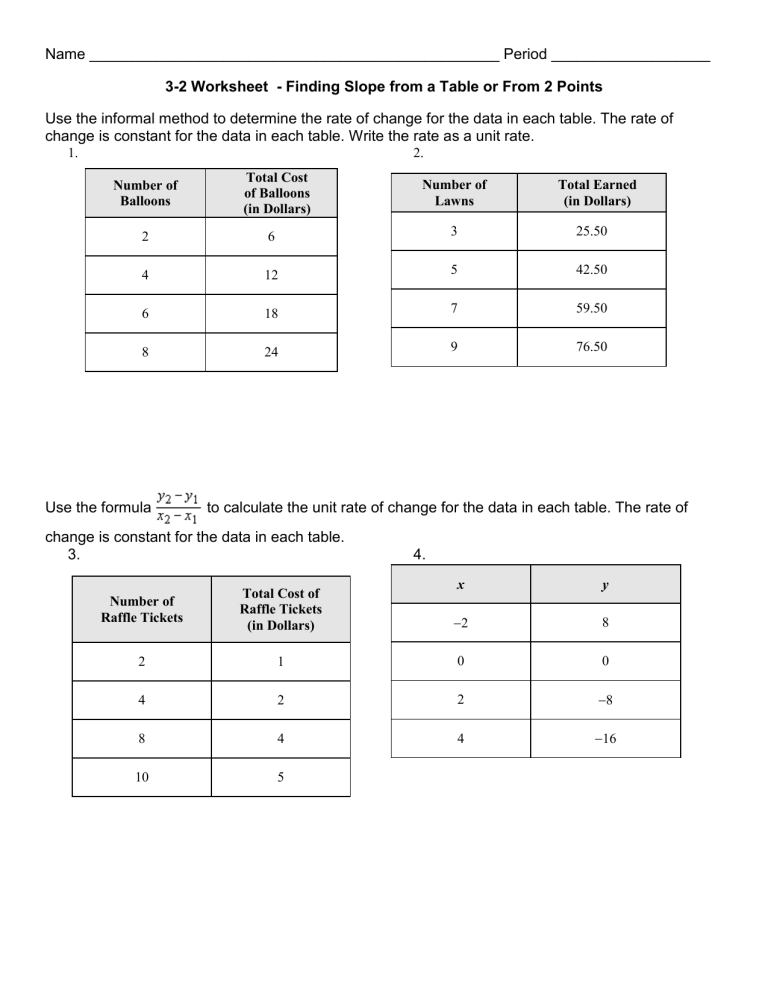
Name _________________________________________________ Period ___________________ 3-2 Worksheet - Finding Slope from a Table or From 2 Points Use the informal method to determine the rate of change for the data in each table. The rate of change is constant for the data in each table. Write the rate as a unit rate. 1. 2. Number of Balloons Total Cost of Balloons (in Dollars) Number of Lawns Total Earned (in Dollars) 2 6 3 25.50 4 12 5 42.50 6 18 7 59.50 8 24 9 76.50 Use the formula to calculate the unit rate of change for the data in each table. The rate of change is constant for the data in each table. 3. 4. Total Cost of Raffle Tickets (in Dollars) x y Number of Raffle Tickets 2 8 2 1 0 0 4 2 2 8 8 4 4 16 10 5 Use the formula to calculate the unit rate of change for the data in each table. The rate of change is constant for the data in each table. 5. 6. Number of Photos Printed Total Cost of Photos (in Dollars) x y 10 2 3 27 20 4 5 45 30 6 7 63 40 8 9 81 Calculate the rate of change between the points listed in each table. Determine if the table represents a linear relationship. 7. 8. x y x y 2 14 10 50 5 35 2 10 7 49 4 20 10 70 14 70 9. 10. x y x y 1 24 6 12 2 48 3 6 4 90 3 6 8 192 6 10


