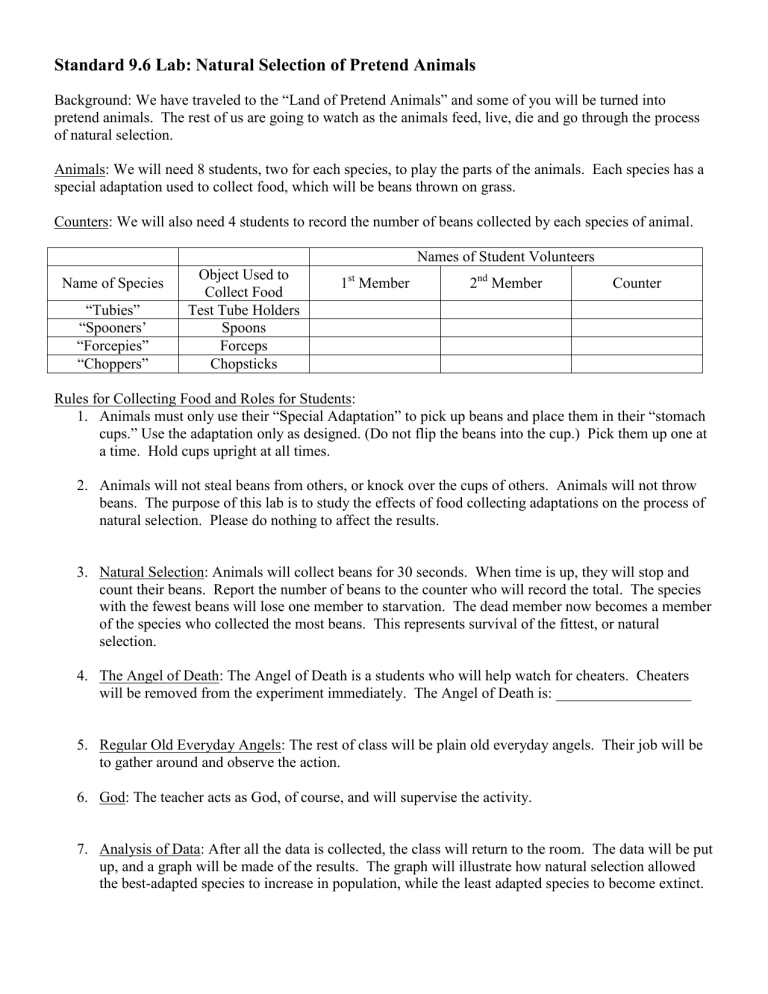
Standard 9.6 Lab: Natural Selection of Pretend Animals Background: We have traveled to the “Land of Pretend Animals” and some of you will be turned into pretend animals. The rest of us are going to watch as the animals feed, live, die and go through the process of natural selection. Animals: We will need 8 students, two for each species, to play the parts of the animals. Each species has a special adaptation used to collect food, which will be beans thrown on grass. Counters: We will also need 4 students to record the number of beans collected by each species of animal. Names of Student Volunteers Name of Species “Tubies” “Spooners’ “Forcepies” “Choppers” Object Used to Collect Food Test Tube Holders Spoons Forceps Chopsticks 1st Member 2nd Member Counter Rules for Collecting Food and Roles for Students: 1. Animals must only use their “Special Adaptation” to pick up beans and place them in their “stomach cups.” Use the adaptation only as designed. (Do not flip the beans into the cup.) Pick them up one at a time. Hold cups upright at all times. 2. Animals will not steal beans from others, or knock over the cups of others. Animals will not throw beans. The purpose of this lab is to study the effects of food collecting adaptations on the process of natural selection. Please do nothing to affect the results. 3. Natural Selection: Animals will collect beans for 30 seconds. When time is up, they will stop and count their beans. Report the number of beans to the counter who will record the total. The species with the fewest beans will lose one member to starvation. The dead member now becomes a member of the species who collected the most beans. This represents survival of the fittest, or natural selection. 4. The Angel of Death: The Angel of Death is a students who will help watch for cheaters. Cheaters will be removed from the experiment immediately. The Angel of Death is: __________________ 5. Regular Old Everyday Angels: The rest of class will be plain old everyday angels. Their job will be to gather around and observe the action. 6. God: The teacher acts as God, of course, and will supervise the activity. 7. Analysis of Data: After all the data is collected, the class will return to the room. The data will be put up, and a graph will be made of the results. The graph will illustrate how natural selection allowed the best-adapted species to increase in population, while the least adapted species to become extinct. Biology 2 Standard 9.6 Lab: Natural Selection of Pretend Animals Title: ________________________________________________________________________________ Purpose: _____________________________________________________________________________ _____________________________________________________________________________________ Hypothesis: I predict that _______________________________________________________________ If my prediction is supported, ____________________________________________________________ Procedure: See handout. Materials: ● ● ● ● ● ● ● ● Results: Table 1. ______________________________________________________________________________ Generation Number Species A. Tubies (Test Tube Holders) B. Spooners (Spoons) C. Forcepies (Forceps) D. Choppers (Chopsticks) 1 # Animals # Beans # Animals # Beans # Animals # Beans # Animals # Beans 2 3 4 5 6 Prepare a graph as instructed below: Title: “Natural Selection of Pretend Animals.” Y-Axis: “Number of Animals Alive Each Generation.” Number from 0 to 8 using every other line X-Axis: “Generation Number.” Number from 1 to 6 using every fourth line. This will spread the data out. Plotting your data: The graph will have four separate lines, one for each animal: A. “Tubies:” Place a dot for each number of animals above each generation. Use a red pencil and connect the dots. B. “Spooners:” Use a blue pencil to plot and connect the points as you did above. C. “Forcepies:” Use a green pencil to plot and connect the points as you did above. D. “Choppers:” Use a regular pencil to plot and connect the points as you did above. 5. Key: Make a key for your lines. 1. 2. 3. 4. Graph 1. ___________________________________________________________________ Discussion: Write a paragraph explaining the results. What did you learn? Did the results support your hypothesis? What were your sources of error, and what are your ideas for further experimentation in this investigation? Conclusion: Briefly restate the significant results in a conclusion statement. ______________________ _______________________________________________________________________________________ _______________________________________________________________________________________ _______________________________________________________________________________________ 1. Which pretend animal was the best adapted to the environment (most fit) in this experiment? Why? 2. Which pretend animal was the least fit in this experiment? Why? 3. How might we conduct this experiment so that a different pretend animal is naturally-selected? Explain.
