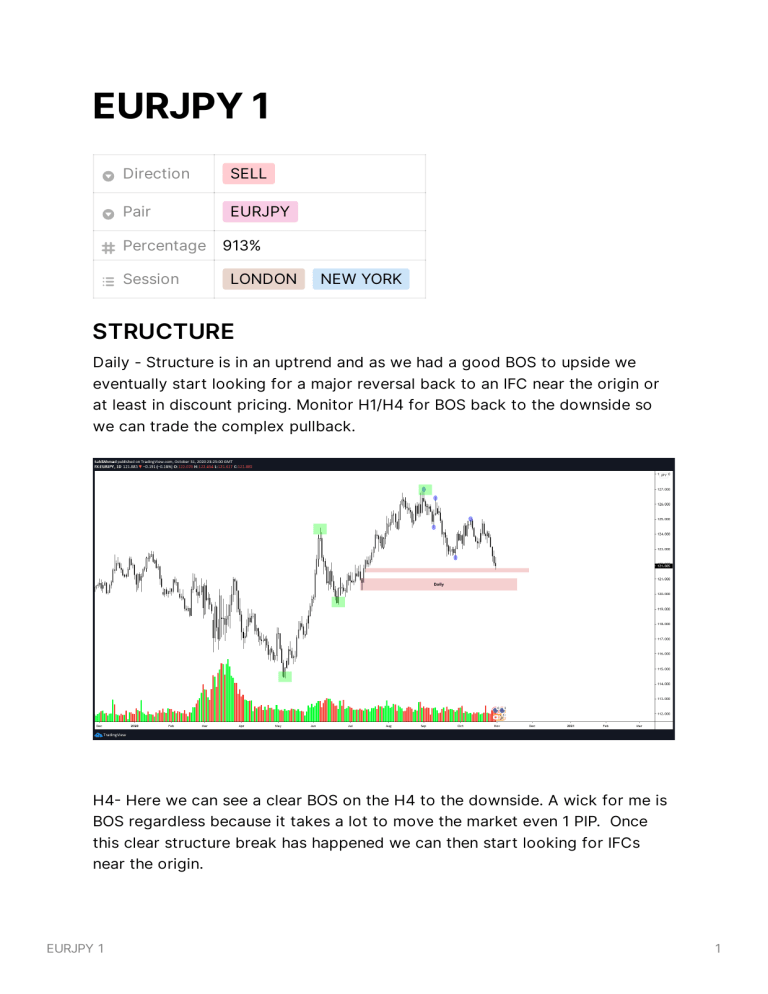
EURJPY 1 Direction SELL Pair EURJPY Percentage Session 913% LONDON NEW YORK STRUCTURE Daily - Structure is in an uptrend and as we had a good BOS to upside we eventually start looking for a major reversal back to an IFC near the origin or at least in discount pricing. Monitor H1/H4 for BOS back to the downside so we can trade the complex pullback. H4 Here we can see a clear BOS on the H4 to the downside. A wick for me is BOS regardless because it takes a lot to move the market even 1 PIP. Once this clear structure break has happened we can then start looking for IFCs near the origin. EURJPY 1 1 Here is structure leading to the high created on the daily. As price was in an uptrend we were expecting a HH to be made after price came back down to our demand area. But instead what happened was that price just shot through it. Therefore we should look inside this area to see if we can find anything that makes sense that we can use as a POI. EURJPY 1 2 Going through all the TFs all we can find is this clear imbalance but no breaker block. So i will try going up the TFs instead to see if there was something that needed mitigating at the open on the HTF. So cycling through the HTFs we find this IFC on the H8 with imbalance that needs mitigating. Why did I do this? As we have seen many times that EURJPY 1 3 mitigations can happen at the open/middle or extreme and it is our job to monitor how price reacts on the LTFs when it gets there. So now that we have our POI which is the imbalance we can drop to LTF and see how price approaches our area. On the H1 we can see that there are a clear set of EQHs just below the imbalance which adds confluence as we no they need to be taken out. EURJPY 1 4 As we come into our POI we can see on the M2 clear structure making HHs. Once it mitigates the the imbalance on the H8 we can see clear order flow followed by a BOS. at the BOS we see a clear breaker block candle which has an IFC with imbalance next to it. This is the area for the first sell. Why this area? This is where price should have come to mitigate the demand to create a new HH but price just went through it leaving that one bullish candle in the middle of all the bearish ones. The IFC is quite big so will use the 50% for entry. 4 PIP SL. Here is the reaction on the H1 showing its a clear IFC EURJPY 1 5 Followed by this we then had a BOS on the H1. We should then look for another entry as we would have taken partials and SL at BE. No risk on the table. Here we can see 1 bullish candle middle of the whole bearish move down. Lets zoom it. Zooming in on the setup there is only this clear IFC with imbalance as everything else above has been mitigated so clean order flow. EURJPY 1 6 BOS of the M5 and i could still not see a clear entry so then i started to zoom out after. This then became a new POI which had clear EQHs below it. Again go to LTF and see if we can get an entry as price approaches it. EURJPY 1 7 As we can see when structure is clear we will always get a very nice clean setup. 1.5 PIP SL. After this we can look for another BOS of the H1 to continue and relook for another entry as our SL would be at BE and partials taken. On the H1 this is our IFC with clear imbalance so lets zoom in again. EURJPY 1 8 Zooming in as price approached the LTF we would have taken a loss or a BE depending on how you manage but we had clear BOS and mitigating of the extreme IFC. We then looked for a 2nd entry as the EQHs were taken out and it presented itself after the miner BOS. 2PIP sl. EURJPY 1 9 I want to finish of with a final one that gives around 5001 RR. So first we had the H4 BOS and then we can start looking at H1 structure and wait for it to align in the same direction as the larger complex pullback. Once we had the BOS lets highlight our IFC and see how price behaves coming into it. EURJPY 1 10 At the high of the H1 Chosen IFC. Drop M4 or lower you will find imbalance. EURJPY 1 11 Lets look at structure coming into our IFC. This wick must have mitigated something on the seconds TF as it looks like an FU candle therefore there has to be an IFC inside it so will target the 50% of it. This is a different confluence i use so i cut my SL in half you could have taken it as the full. EURJPY 1 12 1 PIP SL. This was actually a trade taken by someone. Check the RR now. EURJPY 1 13 So the results over the last 2 months on just 4 positions for this pair but there were many others. These were all just in line with structure and HTF that is all. 1st trade: 112% 2nd trade: 278% 3rd trade: 198% 4th trade: 325% Combined: 913% EURJPY 1 14


