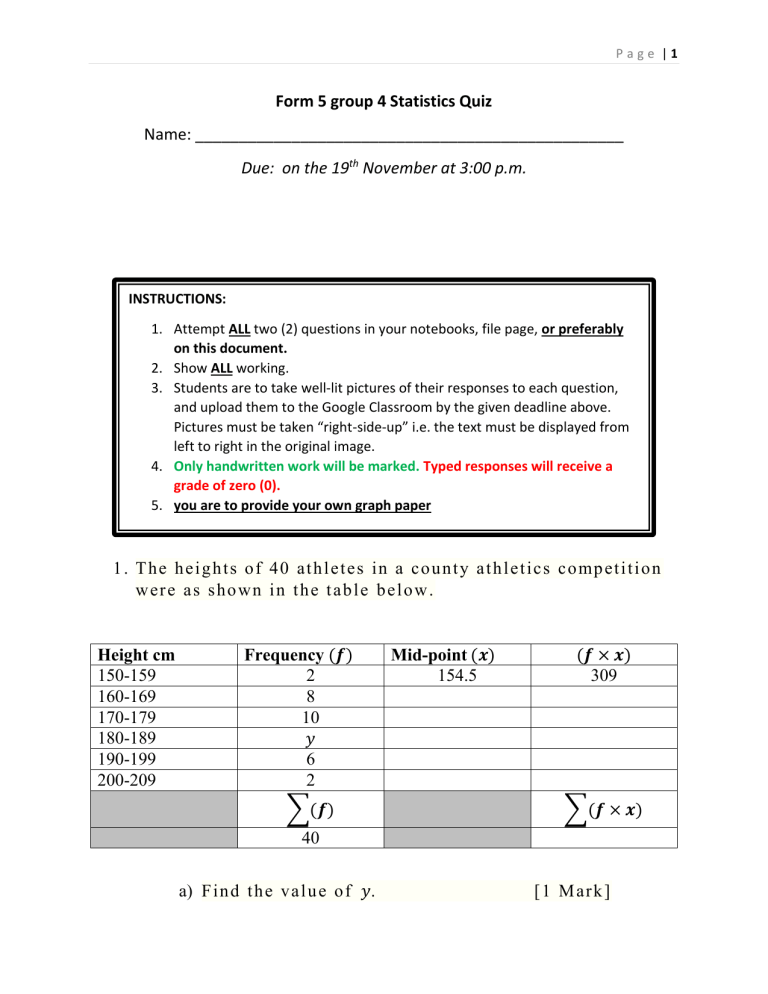
Page |1 Form 5 group 4 Statistics Quiz Name: _________________________________________________ Due: on the 19th November at 3:00 p.m. INSTRUCTIONS: 1. Attempt ALL two (2) questions in your notebooks, file page, or preferably on this document. 2. Show ALL working. 3. Students are to take well-lit pictures of their responses to each question, and upload them to the Google Classroom by the given deadline above. Pictures must be taken “right-side-up” i.e. the text must be displayed from left to right in the original image. 4. Only handwritten work will be marked. Typed responses will receive a grade of zero (0). 5. you are to provide your own graph paper 1 . T h e h e i g h t s o f 40 a t h l e t e s i n a c o u n t y a t h l e t i c s c o mp e t i t i o n w e r e a s s h o wn i n t h e t a b l e b e l o w . Height cm 150-159 160-169 170-179 180-189 190-199 200-209 Frequency (𝒇) 2 8 10 𝑦 6 2 ∑(𝒇) Mid-point (𝒙) 154.5 (𝒇 × 𝒙) 309 ∑(𝒇 × 𝒙) 40 a) F i n d t h e v a l u e o f 𝑦. [1 Mark] Page |2 b) S t a t e t h e mo d a l c l a s s [1 Mark] c) C o mp l e t e t h e t a b l e ( e x c l u d e t h e g r a y s h a d e d a r e a s ) [3 Marks] d) Calculate i. An estimate of the mean height of the athletes [2 Marks] ii. Write down the interval containing the median time. [1 Mark] iii. An athlete was chosen at random. Find the probability that this athlete is less than 170 cm tall. [1 Mark] 2. Bob asked each of 40 friends how many minutes they took to get to work. The table shows some information about his result Time taken t minutes 0 < 𝑡 ≤ 10 10 < 𝑡 ≤ 20 20 < 𝑡 ≤ 30 30 < 𝑡 ≤ 40 40 < 𝑡 ≤ 50 Frequency 3 8 11 9 9 Using the same information from the table above, Bob drew a cumulative Frequency table. Time taken t minutes 0 < 𝑡 ≤ 10 10 < 𝑡 ≤ 20 20 < 𝑡 ≤ 30 30 < 𝑡 ≤ 40 40 < 𝑡 ≤ 50 Upper boundary Time 10 a) Complete the table. Frequency Cumulative Frequency Points to plot 3 8 11 9 9 3 11 (10,3) [3 Marks] Page |3 b) Using 2cm =10 minutes on the horizontal axes and 2cm = 10 people on the vertical axes draw a cumulative frequency curve on graph paper. [5 Marks] c) Using your graph and find: i. The median time [1 Mark] ii. The interquartile range [1 Mark] iii. The number of friends who took more than 35 minutes to get to work. [2 Marks] End of quiz assessment.


