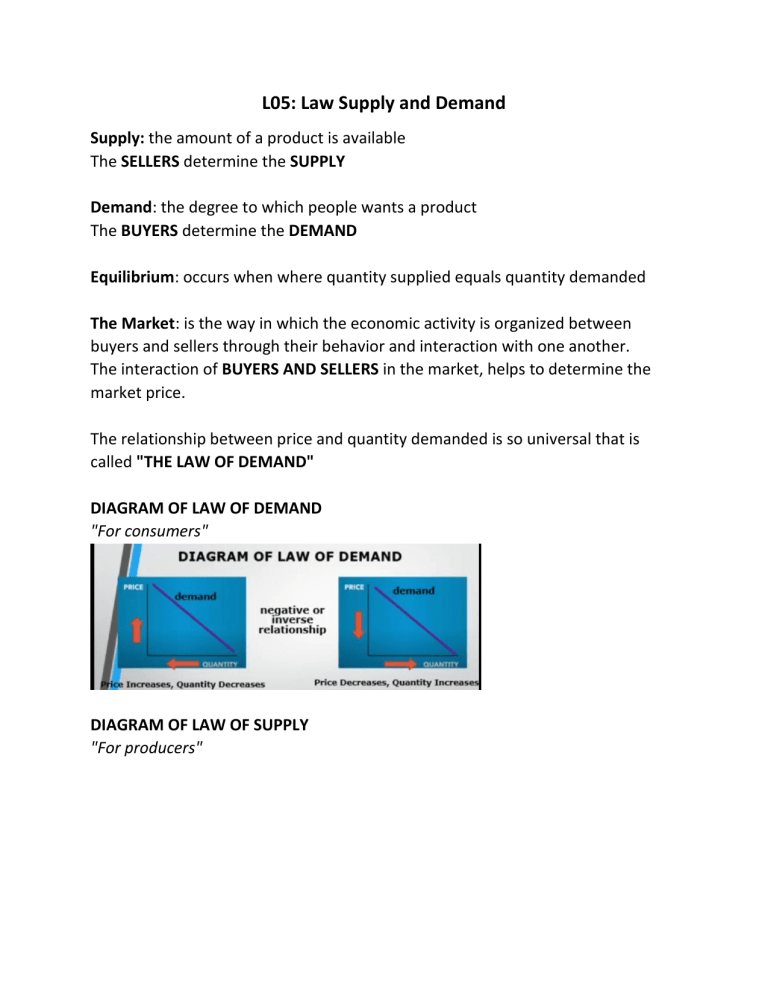
L05: Law Supply and Demand Supply: the amount of a product is available The SELLERS determine the SUPPLY Demand: the degree to which people wants a product The BUYERS determine the DEMAND Equilibrium: occurs when where quantity supplied equals quantity demanded The Market: is the way in which the economic activity is organized between buyers and sellers through their behavior and interaction with one another. The interaction of BUYERS AND SELLERS in the market, helps to determine the market price. The relationship between price and quantity demanded is so universal that is called "THE LAW OF DEMAND" DIAGRAM OF LAW OF DEMAND "For consumers" DIAGRAM OF LAW OF SUPPLY "For producers" DIAGRAM OF MARKET EQUILIBRIUM "Price of goods and services equals quantity demanded" Lack of supply results to shortage More supply results to surplus Supply and demand intersects each other = EQUILIBRIUM FACTORS AFFECTING DEMAND AND SUPPLY Changes In Demand • Income =When income increases they can afford to buy products that means demand increases • Taste and Preferences =seasonal • Expectation (in future prices) =change in price •Market Size •Price of related good and services (substitutes and compliments) DIAGRAM OF CHANGES IN DEMAND Changes In Supply "Producer's intention is to have profit. The lesser the cost, the higher the profit. More production, the higher the profit." •Technology =machine makes easier the production that makes supply increases •Input Prices = if cost goes down, makes produce more • Expectation (in future prices) • Number of producers • Price of related goods and services (Substitutes and compliments) DIAGRAM OF CHANGES IN SUPPLY


