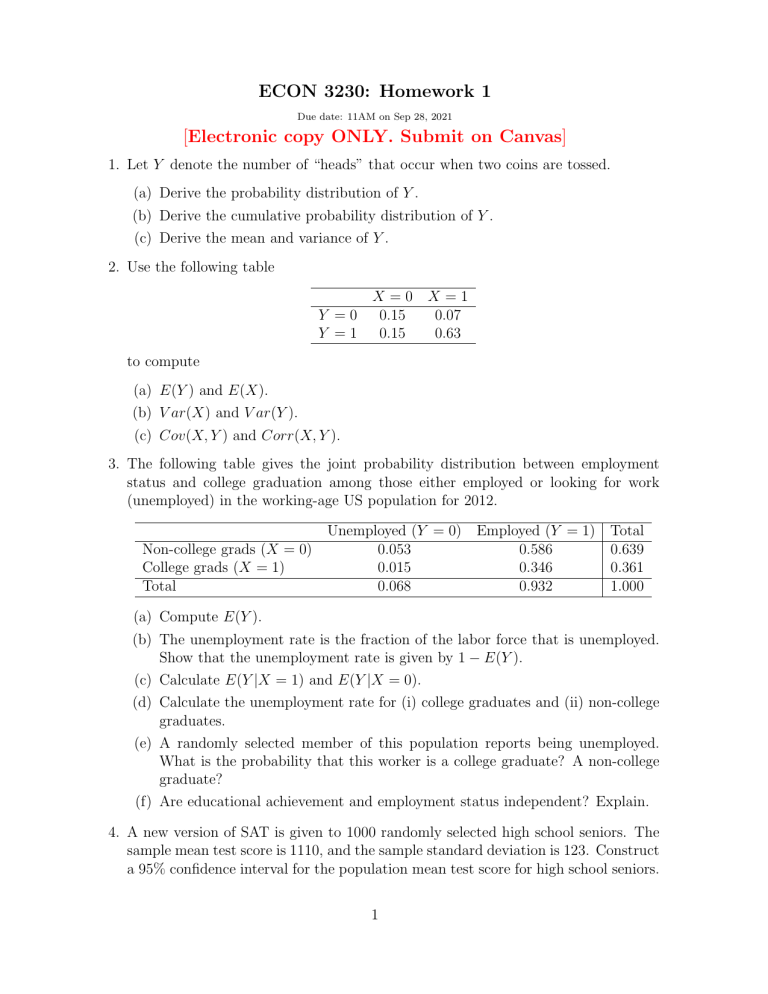
ECON 3230: Homework 1 Due date: 11AM on Sep 28, 2021 [Electronic copy ONLY. Submit on Canvas] 1. Let Y denote the number of “heads” that occur when two coins are tossed. (a) Derive the probability distribution of Y . (b) Derive the cumulative probability distribution of Y . (c) Derive the mean and variance of Y . 2. Use the following table Y =0 Y =1 X=0 X=1 0.15 0.07 0.15 0.63 to compute (a) E(Y ) and E(X). (b) V ar(X) and V ar(Y ). (c) Cov(X, Y ) and Corr(X, Y ). 3. The following table gives the joint probability distribution between employment status and college graduation among those either employed or looking for work (unemployed) in the working-age US population for 2012. Unemployed (Y = 0) Non-college grads (X = 0) 0.053 College grads (X = 1) 0.015 Total 0.068 Employed (Y = 1) Total 0.586 0.639 0.346 0.361 0.932 1.000 (a) Compute E(Y ). (b) The unemployment rate is the fraction of the labor force that is unemployed. Show that the unemployment rate is given by 1 − E(Y ). (c) Calculate E(Y |X = 1) and E(Y |X = 0). (d) Calculate the unemployment rate for (i) college graduates and (ii) non-college graduates. (e) A randomly selected member of this population reports being unemployed. What is the probability that this worker is a college graduate? A non-college graduate? (f) Are educational achievement and employment status independent? Explain. 4. A new version of SAT is given to 1000 randomly selected high school seniors. The sample mean test score is 1110, and the sample standard deviation is 123. Construct a 95% confidence interval for the population mean test score for high school seniors. 1


