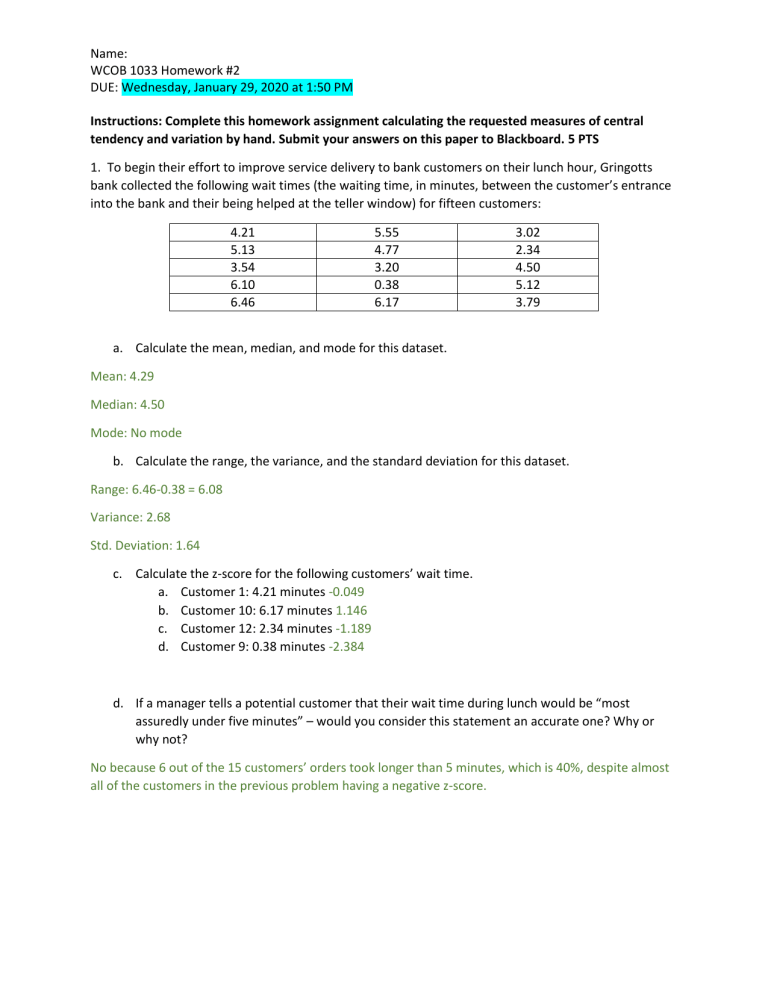
Name: WCOB 1033 Homework #2 DUE: Wednesday, January 29, 2020 at 1:50 PM Instructions: Complete this homework assignment calculating the requested measures of central tendency and variation by hand. Submit your answers on this paper to Blackboard. 5 PTS 1. To begin their effort to improve service delivery to bank customers on their lunch hour, Gringotts bank collected the following wait times (the waiting time, in minutes, between the customer’s entrance into the bank and their being helped at the teller window) for fifteen customers: 4.21 5.13 3.54 6.10 6.46 5.55 4.77 3.20 0.38 6.17 3.02 2.34 4.50 5.12 3.79 a. Calculate the mean, median, and mode for this dataset. Mean: 4.29 Median: 4.50 Mode: No mode b. Calculate the range, the variance, and the standard deviation for this dataset. Range: 6.46-0.38 = 6.08 Variance: 2.68 Std. Deviation: 1.64 c. Calculate the z-score for the following customers’ wait time. a. Customer 1: 4.21 minutes -0.049 b. Customer 10: 6.17 minutes 1.146 c. Customer 12: 2.34 minutes -1.189 d. Customer 9: 0.38 minutes -2.384 d. If a manager tells a potential customer that their wait time during lunch would be “most assuredly under five minutes” – would you consider this statement an accurate one? Why or why not? No because 6 out of the 15 customers’ orders took longer than 5 minutes, which is 40%, despite almost all of the customers in the previous problem having a negative z-score. Name: WCOB 1033 Homework #2 DUE: Wednesday, January 29, 2020 at 1:50 PM 2. Look at the scatterplot below. Would you say the relationship between number of coffees consumed is non-existent, negative, or positive? Why? I would say that there is a weak negative relationship. I think this because while you could draw a line through the points with a negative slope, it would have a shallow angle, making it weak. 1 source: https://onlinecourses.science.psu.edu/stat200/book/export/html/237


