Tuskless Elephants: Natural Selection & Poaching Data Analysis
advertisement

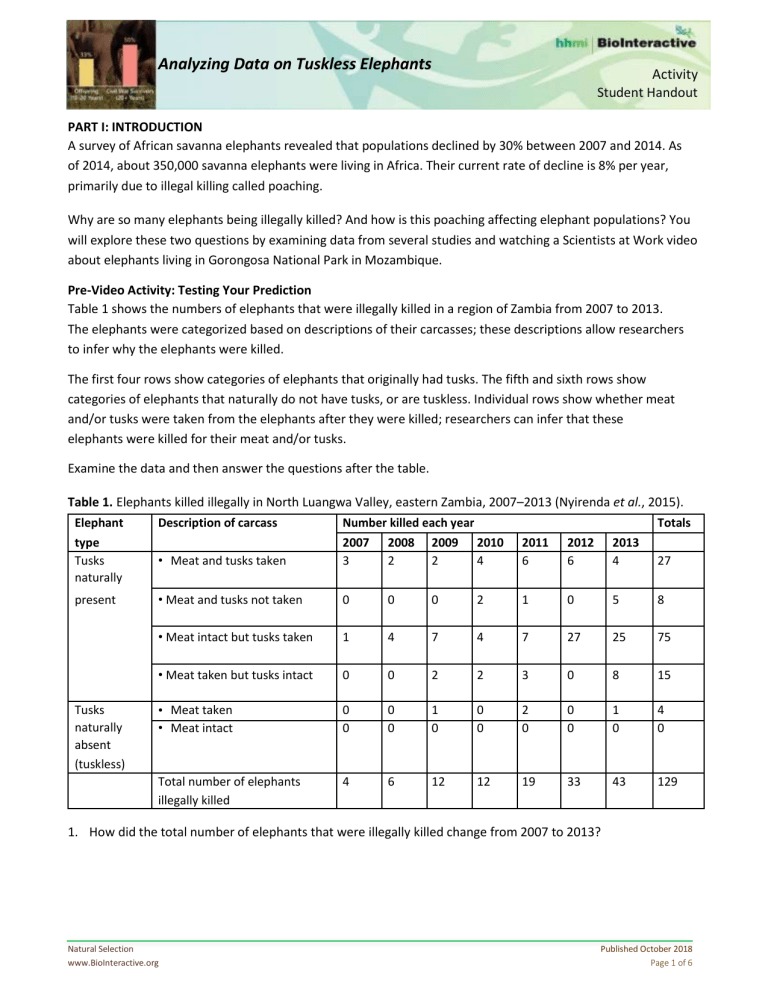
Analyzing Data on Tuskless Elephants Activity Student Handout PART I: INTRODUCTION A survey of African savanna elephants revealed that populations declined by 30% between 2007 and 2014. As of 2014, about 350,000 savanna elephants were living in Africa. Their current rate of decline is 8% per year, primarily due to illegal killing called poaching. Why are so many elephants being illegally killed? And how is this poaching affecting elephant populations? You will explore these two questions by examining data from several studies and watching a Scientists at Work video about elephants living in Gorongosa National Park in Mozambique. Pre-Video Activity: Testing Your Prediction Table 1 shows the numbers of elephants that were illegally killed in a region of Zambia from 2007 to 2013. The elephants were categorized based on descriptions of their carcasses; these descriptions allow researchers to infer why the elephants were killed. The first four rows show categories of elephants that originally had tusks. The fifth and sixth rows show categories of elephants that naturally do not have tusks, or are tuskless. Individual rows show whether meat and/or tusks were taken from the elephants after they were killed; researchers can infer that these elephants were killed for their meat and/or tusks. Examine the data and then answer the questions after the table. Table 1. Elephants killed illegally in North Luangwa Valley, eastern Zambia, 2007–2013 (Nyirenda et al., 2015). Elephant Description of carcass Number killed each year Totals type 2007 2008 2009 2010 2011 2012 2013 Tusks 3 2 2 4 6 6 4 27 • Meat and tusks taken naturally present Tusks naturally absent (tuskless) • Meat and tusks not taken 0 0 0 2 1 0 5 8 • Meat intact but tusks taken 1 4 7 4 7 27 25 75 • Meat taken but tusks intact 0 0 2 2 3 0 8 15 • Meat taken • Meat intact 0 0 0 0 1 0 0 0 2 0 0 0 1 0 4 0 Total number of elephants illegally killed 4 6 12 12 19 33 43 129 1. How did the total number of elephants that were illegally killed change from 2007 to 2013? Natural Selection www.BioInteractive.org Published October 2018 Page 1 of 6 Analyzing Data on Tuskless Elephants Activity Student Handout 2. In general, did most of the elephants that were illegally killed have tusks, or were they naturally tuskless? 3. Calculate the total number of elephants that appear to have been illegally killed between 2007 and 2013 for: a. only their meat b. only their tusks c. both their meat and tusks 4. Calculate the percentages of the illegally killed elephants between 2007 and 2013 represented by each group of elephants in Question 3. Show your work. a. percentage of elephants killed only for their meat b. percentage of elephants killed only for their tusks c. percentage of elephants killed for both their tusks and meat 5. Use the evidence above to make a claim about the main reason elephants were illegally killed in this region. 6. Suggest some ways to reduce the number of elephants that are illegally killed each year. Natural Selection www.BioInteractive.org Published October 2018 Page 2 of 6 Analyzing Data on Tuskless Elephants Activity Student Handout Video Activity 7. Watch the Selection for Tuskless Elephants video until time 1:46 and answer the following questions. a. What did Dr. Joyce Poole observe about the elephant population in Gorongosa National Park in Mozambique? b. What happened in Mozambique from 1977 to 1992? c. How were the elephants in Gorongosa National Park affected by this event? 8. Resume watching the video until time 4:03 and answer the following questions: a. Select all the descriptions that apply to the trait of “tusklessness.” occurs naturally in elephant populations does not occur in nature is common among most elephants is more prevalent in males than females is more prevalent in females than males is inherited b. Dr. Poole says that there is strong selective pressure for male elephants to have tusks. Explain what that means. Natural Selection www.BioInteractive.org Published October 2018 Page 3 of 6 Analyzing Data on Tuskless Elephants Activity Student Handout 9. Resume watching the video until time 4:29, right after you reach the graph below. a. Describe what the bar on the left is showing. b. Describe what the bar on the right is showing. c. Explain why the bar on the right is much higher than the bar on the left. 10. The civil war in Mozambique ended in 1992. Based on the data above, predict whether the percentage of tuskless females born after the civil war was: a. more or less than the percentage of tuskless females that were civil war survivors (bar on the right) b. more or less than the percentage of tuskless females in populations with less poaching (bar on the left) 11. Explain your reasoning for the answers above: a. b. Natural Selection www.BioInteractive.org Published October 2018 Page 4 of 6 Activity Analyzing Data on Tuskless Elephants Student Handout PART II: CONTINUED ANALYSIS 12. Continue watching the video until time 4:56, soon after you reach the graph below. a. You made a prediction in Question 10 about tuskless female elephants born after the civil war ended. These elephants would be 10–20 years of age when Dr. Poole collected her data. Does the data in the graph above support your prediction? Explain why or why not. b. Why might tusklessness be less common in 10- to 20-year-old elephants than in elephants over 20 years of age? Finish watching the video and answer the following questions. 13. Dr. Poole noticed a high proportion of tuskless female elephants in Gorongosa. What was the selective pressure that increased the proportion of tuskless females? 14. No tuskless males have been found in Gorongosa. Why would there be a difference between male and female elephants when it comes to having tusks? Natural Selection www.BioInteractive.org Published October 2018 Page 5 of 6 Activity Analyzing Data on Tuskless Elephants Student Handout Extension Activity Examine the table below. Table 2. Tusklessness in different elephant populations across Africa (Steenkamp et al., 2007). In populations experiencing controlled culling, humans legally removed a restricted number of elephants to prevent overpopulation. These elephants were usually chosen randomly. In populations experiencing poaching, humans illegally killed an unrestricted number of elephants. These elephants were usually killed for their tusks. Level of human activity Minimal human activity Controlled culling High levels of poaching Population Kaudom Moremi Chobe Amboseli Etosha Kruger South Kafue North Kafue Vwaza Adult females Total Number number tuskless 73 0 29 1 66 0 197 3 39 1 104 0 86 2 91 0 19 3 Percent tuskless 0% 3.4% 0% 1.5% 2.6% 0% 2.3% 0% 15.8% Adult males Total number 38 15 20 20 6 24 3 20 0 Number tuskless 0 0 0 0 0 0 0 0 0 South Luangwa 70 17 24.3% 0 0 North Luangwa 86 23 26.7% 8 0 Complete the "Claim-Evidence-Reasoning" chart below. Cite evidence based on the data above or in the Selection for Tuskless Elephants video. Claim: In general, the prevalence of female tuskless elephants is highest in areas with heavy poaching. Evidence: Reasoning: Natural Selection www.BioInteractive.org Published October 2018 Page 6 of 6


