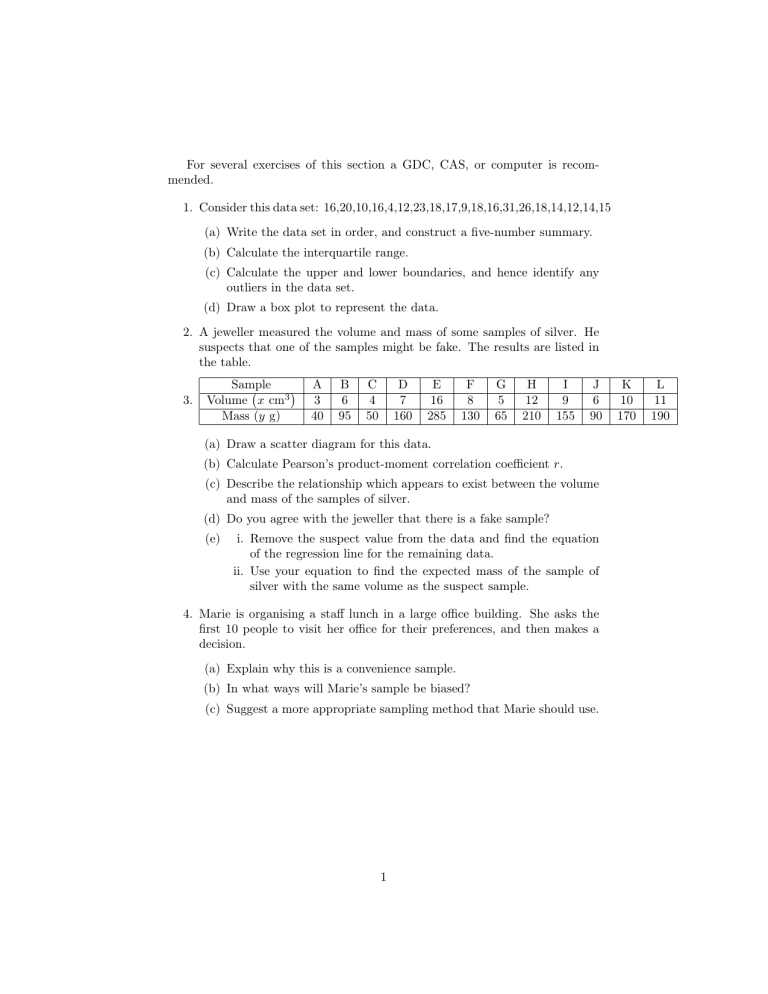
For several exercises of this section a GDC, CAS, or computer is recommended. 1. Consider this data set: 16,20,10,16,4,12,23,18,17,9,18,16,31,26,18,14,12,14,15 (a) Write the data set in order, and construct a five-number summary. (b) Calculate the interquartile range. (c) Calculate the upper and lower boundaries, and hence identify any outliers in the data set. (d) Draw a box plot to represent the data. 2. A jeweller measured the volume and mass of some samples of silver. He suspects that one of the samples might be fake. The results are listed in the table. 3. Sample Volume x cm3 Mass (y g) A 3 40 B 6 95 C 4 50 D 7 160 E 16 285 F 8 130 G 5 65 H 12 210 I 9 155 J 6 90 (a) Draw a scatter diagram for this data. (b) Calculate Pearson’s product-moment correlation coefficient r. (c) Describe the relationship which appears to exist between the volume and mass of the samples of silver. (d) Do you agree with the jeweller that there is a fake sample? (e) i. Remove the suspect value from the data and find the equation of the regression line for the remaining data. ii. Use your equation to find the expected mass of the sample of silver with the same volume as the suspect sample. 4. Marie is organising a staff lunch in a large office building. She asks the first 10 people to visit her office for their preferences, and then makes a decision. (a) Explain why this is a convenience sample. (b) In what ways will Marie’s sample be biased? (c) Suggest a more appropriate sampling method that Marie should use. 1 K 10 170 L 11 190 5. A hospital recorded the age and gender of its 1020 melanoma patients over one year. The data is shown below: < 40 56 75 Male Female Total 40 − 59 127 113 ≥ 60 Total 230 1020 (a) Complete the table (b) Find the probability that a randomly selected melanoma patient was: i. ii. iii. iv. male female and younger than 40 60 or older, given they were female male, given they were 40 or older. 6. A die is rolled, and a square spinner with sectors 1, 2, 3, and 4 is spun. (a) Draw a grid to illustrate the sample space of possible outcomes. (b) Use your grid to find the probability of getting: i. ii. iii. iv. v. vi. two 1s two 5s a sum of 6 a 2 and a 3 a 2 or a 3 or both exactly one 4. 7. Suppose P (A) = 0.37, P (B) = 0.41, and P ((A ∪ B)′ ) = 0.78. (a) Find P (A ∩ B). (b) What can you say about A and B? 8. X has probability distribution x P (X = x) 1 0.25 2 0.38 3 0.17 4 0.2 (a) E(X) (b) V ar(X) (c) σ(X) (d) E(X + 2) (e) V ar(2 − 3x) (f) σ(2x − 10) 2


