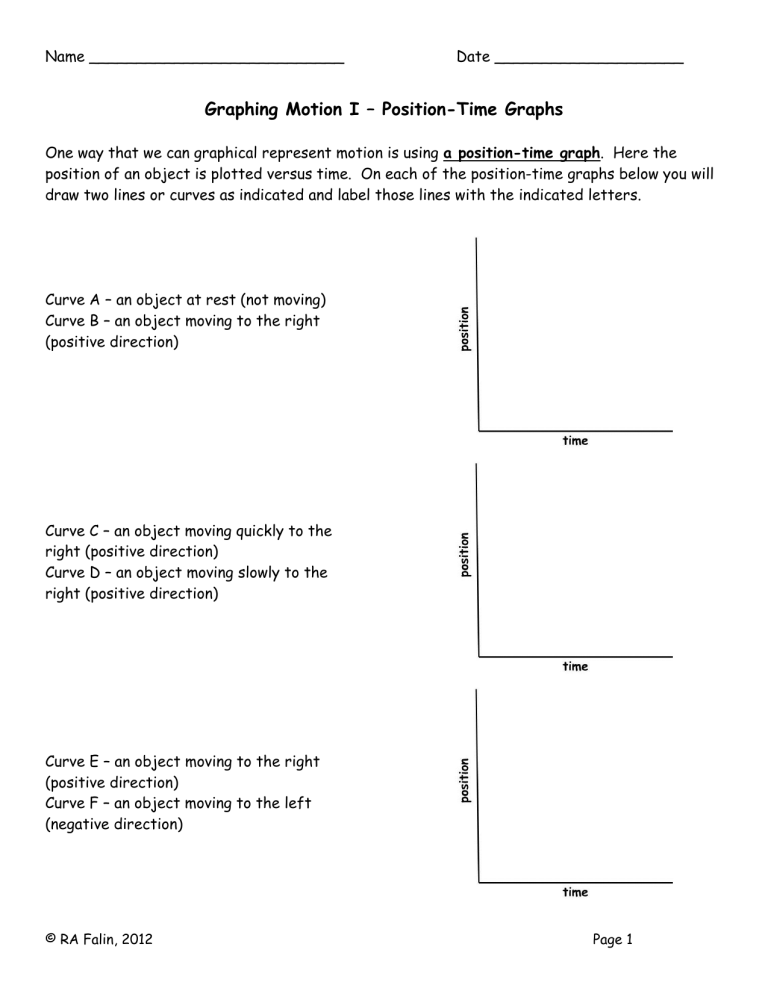
Name ___________________________ Date ____________________ Graphing Motion I – Position-Time Graphs One way that we can graphical represent motion is using a position-time graph. Here the position of an object is plotted versus time. On each of the position-time graphs below you will draw two lines or curves as indicated and label those lines with the indicated letters. Curve A – an object at rest (not moving) Curve B – an object moving to the right (positive direction) Curve C – an object moving quickly to the right (positive direction) Curve D – an object moving slowly to the right (positive direction) Curve E – an object moving to the right (positive direction) Curve F – an object moving to the left (negative direction) © RA Falin, 2012 Page 1 What does the slope of a position-time graph tell you? _____________________________ For this graph to the right, what is the velocity of the object? Show your work. For this graph, what is the velocity of the object? Show your work So far we’ve looked at line graphs, but position-time graphs can be curves as well. Take a look at the following curves and explain what is happening. Between 0 and 5 seconds the slope of this curve is decreasing. Explain this in terms of velocity and acceleration. What happens after the 5 second point? © RA Falin, 2012 Page 2 In this graph, the slope of the curve is increasing. Explain this in terms of velocity and acceleration. We can calculate the average speed and average velocity from a position-time graph as well. What is the average speed (or velocity) for this object for the time period 0 to 10 seconds? Show your work. What is the average speed (or velocity) for this object for the time period 0 to 5 seconds? Show your work. © RA Falin, 2012 Page 3 Okay, let’s consider a more complex motion graph. Here we’re graphing the position of a player on a football field at practice. He starts at the thirty yard line and runs to the 60 yard line. He stays there for a minute and then runs back to the 0 yard line. Using the graph, answer the questions below. Remember that speed a scalar, so only has a magnitude, but velocity is a vector so you have a magnitude and direction (positive or negative). What is the player’s average speed between time 0 and 60 seconds? What is the player’s average velocity between 0 and 20 seconds? What is the player’s average velocity between 70 and 100 seconds? What is the player’s average velocity between 0 and 100 seconds? © RA Falin, 2012 Page 4
