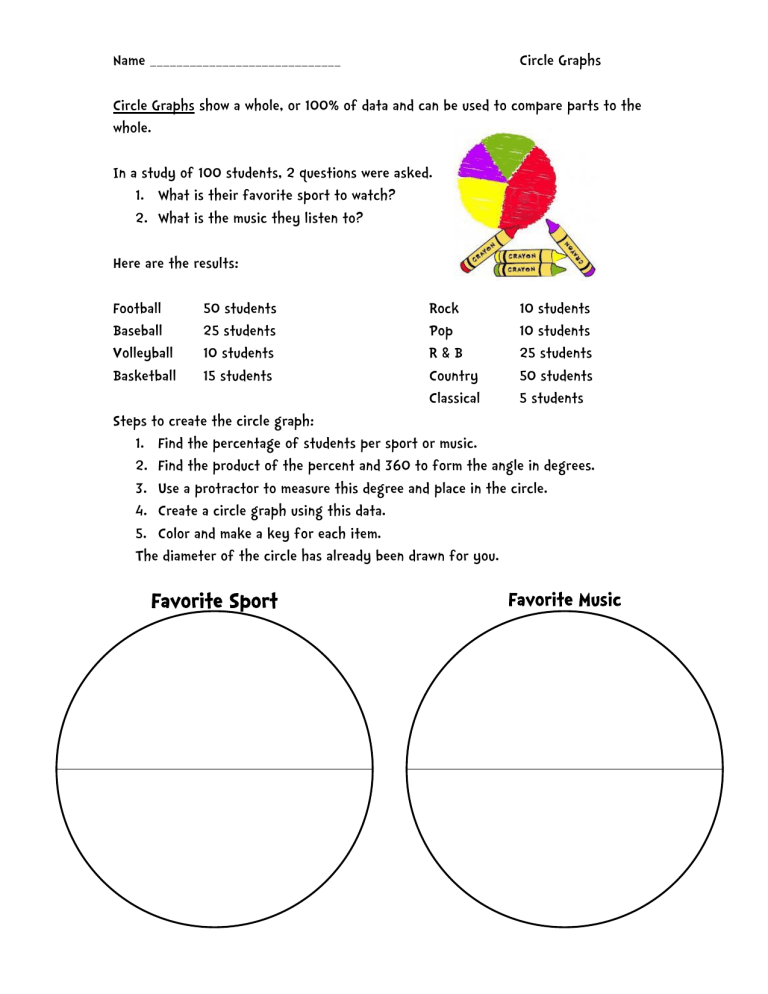
Name _____________________________ Circle Graphs Circle Graphs show a whole, or 100% of data and can be used to compare parts to the whole. In a study of 100 students, 2 questions were asked. 1. What is their favorite sport to watch? 2. What is the music they listen to? Here are the results: Football Baseball Volleyball Basketball 50 students 25 students 10 students 15 students Rock Pop R&B Country Classical 10 students 10 students 25 students 50 students 5 students Steps to create the circle graph: 1. Find the percentage of students per sport or music. 2. Find the product of the percent and 360 to form the angle in degrees. 3. Use a protractor to measure this degree and place in the circle. 4. Create a circle graph using this data. 5. Color and make a key for each item. The diameter of the circle has already been drawn for you. Favorite Sport Favorite Music
