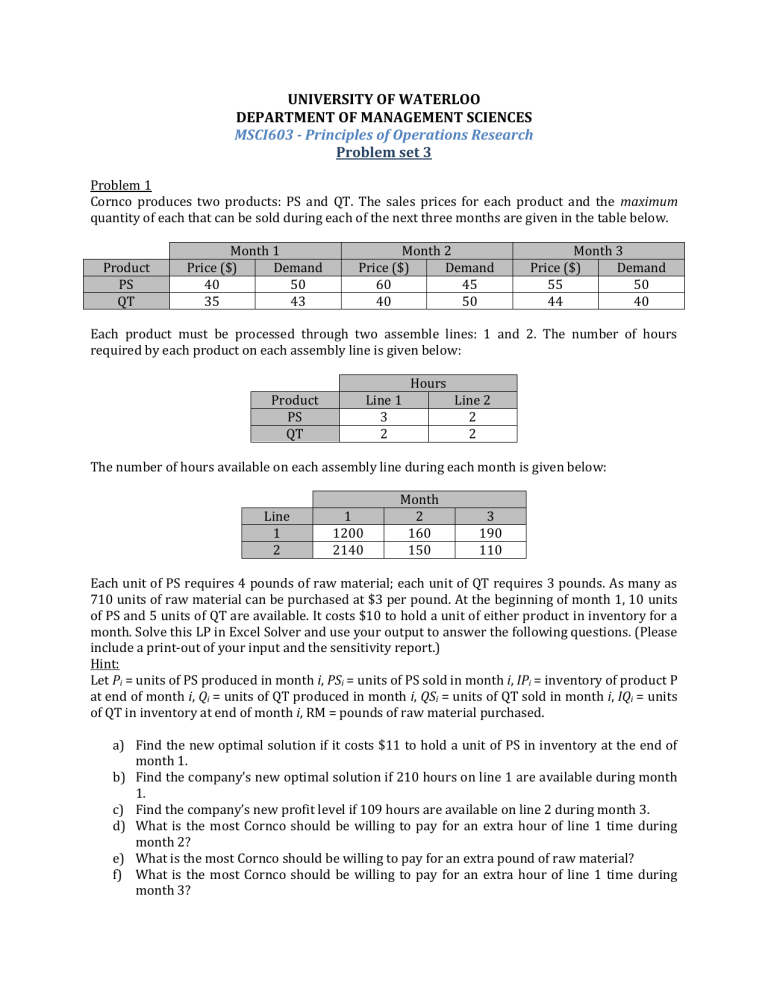
UNIVERSITY OF WATERLOO DEPARTMENT OF MANAGEMENT SCIENCES MSCI603 - Principles of Operations Research Problem set 3 Problem 1 Cornco produces two products: PS and QT. The sales prices for each product and the maximum quantity of each that can be sold during each of the next three months are given in the table below. Product PS QT Month 1 Price ($) Demand 40 50 35 43 Month 2 Price ($) Demand 60 45 40 50 Month 3 Price ($) Demand 55 50 44 40 Each product must be processed through two assemble lines: 1 and 2. The number of hours required by each product on each assembly line is given below: Hours Product PS QT Line 1 3 2 Line 2 2 2 The number of hours available on each assembly line during each month is given below: Line 1 2 1 1200 2140 Month 2 160 150 3 190 110 Each unit of PS requires 4 pounds of raw material; each unit of QT requires 3 pounds. As many as 710 units of raw material can be purchased at $3 per pound. At the beginning of month 1, 10 units of PS and 5 units of QT are available. It costs $10 to hold a unit of either product in inventory for a month. Solve this LP in Excel Solver and use your output to answer the following questions. (Please include a print-out of your input and the sensitivity report.) Hint: Let Pi = units of PS produced in month i, PSi = units of PS sold in month i, IPi = inventory of product P at end of month i, Qi = units of QT produced in month i, QSi = units of QT sold in month i, IQi = units of QT in inventory at end of month i, RM = pounds of raw material purchased. a) Find the new optimal solution if it costs $11 to hold a unit of PS in inventory at the end of month 1. b) Find the company’s new optimal solution if 210 hours on line 1 are available during month 1. c) Find the company’s new profit level if 109 hours are available on line 2 during month 3. d) What is the most Cornco should be willing to pay for an extra hour of line 1 time during month 2? e) What is the most Cornco should be willing to pay for an extra pound of raw material? f) What is the most Cornco should be willing to pay for an extra hour of line 1 time during month 3? g) Find the new optimal solution if PS sells for $50 during month 2. h) Find the new optimal solution if QT sells for $50 during month 3. i) Suppose spending $20 on advertising would increase demand for QT in month 2 by 5 units. Should the advertising be done? Solution MAX 40 PS1 + 60 PS2 + 55 PS3 + 35 QS1 + 40 QS2 + 44QS3 - 3 RM 10(IP1+IP2+IP3+IQ1+IQ2+IQ3) s.t. 2) P1S ≤ 50 3) P2S ≤ 45 4) P3S ≤ 50 5) Q1S ≤ 43 6) Q2S ≤ 50 7) Q3S ≤ 40 8) 3 P1 + 2 Q1 ≤ 1200 9) 3 P2 + 2 Q2 ≤ 160 10) 3 P3 + 2 Q3 ≤ 190 11) 2 P1 + 2 Q1 ≤ 2140 12) 2 P2 + 2 Q2 ≤ 150 13) 2 P3 + 2 Q3 ≤ 110 14) PS1 + IP1 - P1 = 10 15) PS2 - IP1 + IP2 - P2 = 0 16) PS2 - IP2 + IP3 - P3 = 0 17) QS1 + IQ1 - Q1 = 5 18) QS2 - IQ1 + IQ2 - Q2 = 0 19) QS3 - IQ2 + IQ3 - Q3 = 0 20) - RM + 4 P1 + 3 Q1 + 3 Q2 + 4 P2 + 4 P3 + 3 Q3 ≤ 0 21) RM ≤ 710 All variables ≥ (See Excel file for Sensitivity and Answer Reports) a) Allowable increase for 𝐼𝑃1 is 4, so a $1 increase is within the allowable limit. Profit Down by ($1)* 𝐼𝑃1 = $25. New Profit = 7705 - 25 = $7680. b) This is a non-binding constraint, so the Shadow Price = 0 and allowable decrease is 1010.75. Constraint has positive slack. Thus new optimal solution remains the same. c) Allowable decrease is 10 hours, so this 1 hour decrease is within the allowable limit. The shadow price for the constraint is 7, so the new profit is 7705 – 7(1) = $7698. d) The most Cornco will pay is equal to the shadow price of this constraint = $3.33 e) From constraint 20, the shadow price $10. This is what we would gain if given a "free pound of raw material. Thus we would pay up to $10. f) This is a non-binding constraint, meaning there is slack in this constraint. We are not willing to pay anything for any additional time (shadow price is 0). g) A decrease of 10 is within the allowable decrease for this variable, so decision variables remain the same. New z-value = 7705 - 10(45) = $7255. h) An increase of 6 is not within the allowable increase of 1, so current basis is no longer optimal and question cannot be answered from current printout. Problem 2 A furniture company makes tables (T) and chairs (C), and sells them to customers either finished (F) or unfinished (U). The amount of wood and labor needed, and the selling price of each product are shown in the next table: Product Wood (ft2) Labor (hr) Price ($) UT 40 2 70 FT 40 5 140 UC 30 2 60 FC 30 4 110 If 40,000 board feet of wood and 6,000 hours of skilled labor are available. Use the sensitivity analysis output report to answer the next parts, independently. a) How much improvement in the profit can be achieved by: i. increasing the quantity of wood available by 3,000 ft2, ii. increasing the number of labor hours available by 500 hours. b) How much rise in the price of finished tables is needed for the company to start producing them? c) If the company reduces the selling price of finished chair by $5, will it need to change its product mix to optimize its profit. Solution Below is a copy of the sensitivity analysis report generated by Excel Variable Cells Final Reduced Objective Allowable Allowable Cell Name Value Cost Coefficient Increase Decrease $B$4 UT 0 -76.66666667 70 76.66666667 1E+30 $C$4 FT 0 -6.666666667 140 6.666666667 1E+30 $D$4 UC 0 -50 60 50 1E+30 $E$4 FC 1333.333333 0 110 1E+30 5 Constraints Final Shadow Constraint Allowable Allowable Cell Name Value Price R.H. Side Increase Decrease $F$5 Wood LHS 40000 3.666666667 40000 5000 40000 $F$6 Labor LHS 5333.333333 0 6000 1E+30 666.6666667 a) i. Allowable increase of wood quantity without changing the basis is 5000, so we can use sensitivity analysis. Shadow price of wood = 3.67, so increasing the quantity of wood by 3000 will increase the profit by $11,000. ii. The shadow price of labor hour is zero (the constraint is non-binding), so increasing the quantity of labor hours will not affect the profit. b) The reduced cost of finished tables (FT) is 6.67, so the price of finished tables must increase by this amount before the company starts producing them. c) The allowable decrease in the FC coefficient in the objective function is 5, so the company doesn’t need to change its product mix. Problem 3 A dairy producer makes two types of cheese. The only scarce resource that is needed to produce cheese is skilled labor. The company has two specialized workers. The first (W1) is willing to work for up to 40 hours per week and is paid $25 per hour. The second (W2) is willing to work for up to 50 hours per week and is paid $30 per hour. The time for each worker and raw materials costs required to produce a unit of each type of cheese and its selling price are shown in the table below. Type 1 2 W1 (hr) 1 2 W2 (hr) 2 2 Raw material cost ($) 250 200 Selling Price ($) 400 420 a. Formulate an LP model for this problem to maximize the profit of the dairy producer. b. Solve the LP model graphically. c. From the graphical solution obtained in (b) determine the range of prices of types 1 and 2 cheese at which the current basis remain optimal. d. If W1 worker is willing to work only 30 hours per week, would the current basis remain optimal? Would the optimal solution change? e. Determine the maximum amount that should be paid to each worker for an additional hour of work every week. f. If W2 worker is willing to work only 48 hours, what would the company’s profit be? Verify your answer graphically. Solution a. x1 = the number of type 1 cheese produced x2 = the number of type 2 cheese produced max (400‐250)x1+(420‐200)x2 ‐25(x1+2x2) – 30(2x1+2x2) s.t. x1+2x2 <= 40 2x1+2x2 <= 50 x1>=0, x2 >=0 b. The optimal solution is the intersecting point of the two constraints, which is (10,15) and a profit of 2300. c. The current solution will remain optimal as long as the slope of the iso-profit line remains between the slopes of the binding constraints. For type 1 cheese: 1 c1 2 − 2 ≥ − 110 ≥ − 2 so the price of type 1 cheese can range between 390 and 445 $/unit without changing the optimal solution. For type 2 cheese: 1 65 1 − 2 ≥ − c2 ≥ − 1 so the price of type 2 cheese can range between 375 and 440 $/unit without changing the optimal solution. d. Yes. The new optimal solution will be (x1,x2) = (20,5) and a profit of 1850. e. The shadow price is (y1,y2) = (45,10) The maximum amount that should be paid for an additional hour per week to worker 1 is 45. The maximum amount that should be paid for an additional hour per week to worker 2 is 10. f. The company’s profit decreases by 10*(50‐48) = 20. The graphical solution is (x1,x2) = (8,16), and the profit is 2280. Problem 4 A workshop makes two types of hand-made genuine leather products: wallets and belts. Each wallet requires 1 square foot of leather and 30 minutes of labor time. Each belt requires 2 square feet of leather and 20 minutes of labor time. The workshop earns $40 profit from each wallet sold and $50 from each belt sold. Each day there are 500 square feet of leather and 200 labor-hours available. a. Formulate an LP for this problem and solve it using the graphical method. b. What is the maximum amount the workshop shall be willing to pay for an extra hour of labor? c. What is the maximum amount the workshop shall be willing to pay for an extra square foot of leather? d. What is the profit range of wallets that will keep the optimal solution unchanged? e. What is the profit range of belts that will keep the optimal solution unchanged? f. By how much the workshop can increase or decrease the quantity of leather available without changing its optimal product mix? g. What is the impact of increasing the labor time by 10 hours daily on the workshop profit? Solution a. Let W be the number of wallets and B be the number of belts produced daily. Max 40 W + 50 B s.t. W + 2B <= 500 (Leather constraint) a. W/2 + B/3 <= 200 (Labor constraint) b. W, B >= 0 By solving using the graphical method we find that: W* = 350, B* = 75, Z* = 17750 b. The workshop shall not pay more than the dual price of the second constraint. To find it we solve the two equations: W + 2B = 500 W/2 + B/3 = 201 The solution is: W = 353, B = 73.5 By plugging these values in the objective function, we get Z_new = 17795 Dual price = Z_new – Z_old = $45 c. The same method as in part (b) d. We need to find the range of optimality. For the optimal solution to remain unchanged, the slope of the iso-profit line must remain within the slopes of the binding constraints. (-3/2) <= (-c/50) <= (-1/2) 25 <= c <= 75 So the profit range of wallets can range between 25 and 75 without changing the optimal solution e. The same method as in part (d) f. To maintain the same product mix, the binding constraints must remain binding. So, the first constraint can shift parallel to itself between points (400,0) and (0,600). The RHS of the leather constraint at these points has values of 400 and 1200, respectively. So this is the range of leather availability at which both products are in the optimal product mix. g. Z_new – Z_old = change in RHS * dual price = 10 * 45 (from part b) = $450 increase in the profit. Problem 5 Farmer Leary grows wheat and corn in his 45-acre farm. He can sell at most 140 bushels of wheat and 120 bushels of corn. Each planted acre yields either 5 bushels of wheat or 4 bushels of corn. Wheat sells for $30 per bushel, and corn sells for $50 per bushel. Six hours of labor are needed to harvest an acre of wheat, and ten hours are needed to harvest an acre of corn. As many as 350 hours of labor are available. a) Formulate the problem as an LP model, and solve it graphically. b) What is the range of wheat and corn prices that will keep the current basis optimal? c) What is the range of land and labor availability that will keep the current basis optimal? Solution: a) Decision Variables 𝑥𝑤 𝑛𝑢𝑚𝑏𝑒𝑟 𝑜𝑓 𝑎𝑐𝑟𝑒𝑠 𝑝𝑙𝑎𝑛𝑡𝑒𝑑 𝑤𝑖𝑡ℎ 𝑤ℎ𝑒𝑎𝑡 𝑥𝑐 𝑛𝑢𝑚𝑏𝑒𝑟 𝑜𝑓 𝑎𝑐𝑟𝑒𝑠 𝑝𝑙𝑎𝑛𝑡𝑒𝑑 𝑤𝑖𝑡ℎ 𝑐𝑜𝑟𝑛 Constraints 5𝑥𝑤 ≤ 140 Demand limit for wheat 4𝑥𝑐 ≤ 120 Demand limit for corn 𝑥𝑤 + 𝑥𝑐 ≤ 45 Land availability 6𝑥𝑤 + 10𝑥𝑐 ≤ 350 Labour availability Objective Function max 5 ∗ 30𝑥𝑤 + 4 ∗ 50𝑥𝑐 = 150𝑥𝑤 + 200𝑥𝑐 The graphical solution is shown in the figure below. 50 45 40 35 C2 b 30 25 C1 20 Optimal solution 15 C4 a 10 5 C3 5 10 15 20 25 30 35 40 45 50 55 60 Xw Iso-profit line ∗ 𝑥𝑤 = 25 𝑎𝑐𝑟𝑒 𝑥𝑐∗ = 20 𝑎𝑐𝑟𝑒 𝑧 ∗ = $7,750 b) The current solution will remain optimal as long as the slope of the iso-profit line remains between the slopes of the binding constraints> For wheat: 3 𝑐 1 − ≥− 𝑤 ≥− or 120 ≤ 𝑐𝑤 ≤ 200 , so the price of wheat can range between 24 and 40 5 200 1 $/bushel without changing the optimal solution. For corn: 3 5 − ≥− 150 𝑐𝑐 ≥− 1 1 or 150 ≤ 𝑐𝑐 ≤ 250 , so the price of corn can range between 37.5 and 62.5 $/bushel without changing the optimal solution. c) Land availability: C3 can shift up parallel to itself without changing the basis until it hits the intersection of C1 and C4. This point is (28,18.2). The RHS of C3 at this point is 46.2 acre. C3 can shift down parallel to itself without changing the basis until it hits the intersection of C2 and C4. This point is (8.33,30). The RHS of C3 at this point is 38.33 acre. Labor availability: C4 can shift up parallel to itself without changing the basis until it hits the intersection of C2 and C3. This point is (15,30). The RHS of C4 at this point is 390 hours. C4 can shift down parallel to itself without changing the basis until it hits the intersection of C1 and C3. This point is (28,17). The RHS of C4 at this point is 338 hours. Problem 6 An investor has 4 investment alternatives for the next year: Gold (G), Certificates of deposit (C), Bonds (B) and Stocks (S). The expected return and the risk score for these investments are shown below: Investment type G C B S Expected return 2% 4% 6% 10% Risk score 2 1 3 6 Available funds are to be allocated between the different alternatives such that: 1. expected total return (i.e., profit) is at least 5% 2. average risk score does not exceed 2 3. at most half of the funds are invested in fixed income instruments (C and B) Formulate an LP to determine the optimal investment plan. Solve it using Excel. If possible without resolving the problem, use the sensitivity report to answer the following questions: a. If the expected return of the certificates of deposit falls by 0.1%, how would this affect the allocation and the profit? b. What is the minimum expected return of bonds that justifies buying them? c. If the investment policy requires at least 5% of the investment to be held as gold, how would that affect the profit? d. The return of stocks is known to be volatile and may fall short of expectations. What is the minimum expected return of stocks such that the current allocation is not changed? e. If the investor’s risk tolerance becomes higher such that a risk score of 3 is now acceptable, how would that affect the allocation and the profit? f. The investor lowers its acceptable profit threshold to 4.5%. How would this affect the allocation and the profit? g. The minimum percentage of funds to be invested in fixed income instruments in increased to 75%. How would this affect the allocation and the profit? h. A new assessment reached a conclusion that gold is no longer a suitable alternative for this investor. How would that affect the allocation? i. A new investment product called “leveraged ETF” is introduced, which has a risk score of 8. What is the minimum expected return that justifies allocating funds to this product? Solution Let G, C, B and S be the percentages of funds invested in gold, certificates of deposit, bonds and stocks, respectively. The problem can be formulated as: Max z= 2G+4C+6B+10S s.t 2G+4C+6B+10S>=5 (expected return) 2G+ C+3B+ 6S<=2 (risk score) C+ B >=0.5 (minimum fixed income investment ratio) G+ C + B+ S = 1 (all funds are invested) G, C, B, S >=0 The optimal solution is: G=0, C=0.8, B=0, S=0.2, z=5.2% Below is the Excel sensitivity report Final Reduced Objective Allowable Allowable Cell Name Value Cost Coefficient Increase Decrease $B$2 G 0 -3.2 2 3.2 1E+30 $C$2 C 0.8 0 4 6 0.666666667 $D$2 B 0 -0.4 6 0.4 1E+30 $E$2 S 0.2 0 10 1E+30 1 Cell $F$3 $F$4 $F$5 $F$6 Final Name Value LHS 5.2 LHS 2 LHS 0.8 LHS 1 Shadow Price 0 1.2 0 2.8 Constraint Allowable Allowable R.H. Side Increase Decrease 5 0.2 1E+30 2 1.5 0.166666667 0.5 0.3 1E+30 1 1 0.071428571 a. The decrease in C coefficient is within the allowable limit (<0.66667), so the optimal solution (allocation) will not change, but the profit will decrease by 0.1*0.8=0.08 to 5.12% b. The reduced cost of B is -0.4. Thus, the expected return of bonds must increase by 0.4 to 6.4% for B to enter the basis (assume a non-zero value, add bonds to the portfolio) c. A unit of G forced into the optimal solution will lower the objective value by the reduced cost of G. Thus, a 0.05 units will cause a decline of 0.05*3.2= 0.16% in profit to 5.04% d. Allowable decrease in the coefficient of S is 1. Thus, the minimum expected return of stocks so the current allocation remains optimal is 10-1=9% e. The shadow price of the risk score constraint is +1.2 and the allowable increase is 1.5>=1. So, if the RHS of this constraint increases by one unit the objective function improves by 1.2 units to 5.2+1.2=6.4%. The basis (and hence the binding constraints) remain unchanged. Solving the equations: C+6S=3 and C+S=1 yields: C=0.6 and S=0.4, so z=4(0.6)+10(0.4)=6.4% (the same result found using the shadow price) f. The expected return constraint is non-binding and the allowable decrease in the RHS is infinite. Thus, no effect on the allocation or profit will result from this change in parameters. g. The allowable increase in the RHS of constraint 3 without changing the basis is 0.3 which is greater than 0.25. This is a non-binding constraint and will remain non-binding, thus nothing will change. h. This change is equivalent to adding the constraint G=0. Since the current optimal solution does not violate the new constraint, it has no effect on the allocation or profit. i. Adding a unit of the new product reduces the RHS of constraint 2 by 8 units and constraint 4 by 1 unit, meaning it reduces the profit by 8(1.2)+1(2.8)=12.4%. This is the minimum expected profit that justifies adding the new product to the portfolio.


