Sterile Processing Benchmarks: Designing a Central Supply Dept
advertisement
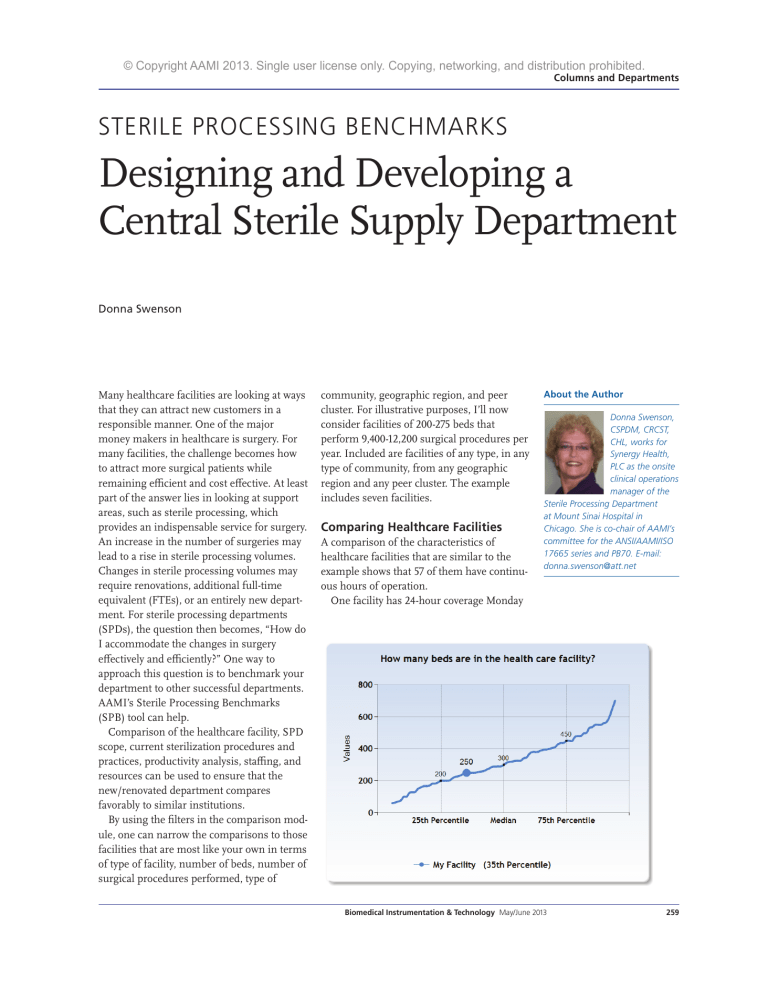
© Copyright AAMI 2013. Single user license only. Copying, networking, and distribution prohibited. Columns and Departments STERILE PROCESSING BENCHMARKS Designing and Developing a Central Sterile Supply Department Donna Swenson Many healthcare facilities are looking at ways that they can attract new customers in a responsible manner. One of the major money makers in healthcare is surgery. For many facilities, the challenge becomes how to attract more surgical patients while remaining efficient and cost effective. At least part of the answer lies in looking at support areas, such as sterile processing, which provides an indispensable service for surgery. An increase in the number of surgeries may lead to a rise in sterile processing volumes. Changes in sterile processing volumes may require renovations, additional full-time equivalent (FTEs), or an entirely new department. For sterile processing departments (SPDs), the question then becomes, “How do I accommodate the changes in surgery effectively and efficiently?” One way to approach this question is to benchmark your department to other successful departments. AAMI’s Sterile Processing Benchmarks (SPB) tool can help. Comparison of the healthcare facility, SPD scope, current sterilization procedures and practices, productivity analysis, staffing, and resources can be used to ensure that the new/renovated department compares favorably to similar institutions. By using the filters in the comparison module, one can narrow the comparisons to those facilities that are most like your own in terms of type of facility, number of beds, number of surgical procedures performed, type of community, geographic region, and peer cluster. For illustrative purposes, I’ll now consider facilities of 200-275 beds that perform 9,400-12,200 surgical procedures per year. Included are facilities of any type, in any type of community, from any geographic region and any peer cluster. The example includes seven facilities. Comparing Healthcare Facilities A comparison of the characteristics of healthcare facilities that are similar to the example shows that 57 of them have continuous hours of operation. One facility has 24-hour coverage Monday About the Author Donna Swenson, CSPDM, CRCST, CHL, works for Synergy Health, PLC as the onsite clinical operations manager of the Sterile Processing Department at Mount Sinai Hospital in Chicago. She is co-chair of AAMI’s committee for the ANSI/AAMI/ISO 17665 series and PB70. E-mail: donna.swenson@att.net Biomedical Instrumentation & Technology May/June 2013 259 © Copyright AAMI 2013. Single user license only. Copying, networking, and distribution prohibited. Columns and Departments ing facility is planning on implementing a formal system to handle complaints and other issues. A review of the information under the compliance tab reveals that the majority of facilities review policies and procedures to ensure compliance with regulatory agencies and professional organizations. Eighty-six percent ensure compliance with the U.S. Food and Drug Administration (FDA), the Occupational Safety and Health Administration (OSHA), and state and local agencies. One hundred percent ensure compliance with AAMI standards and 86% with practices from the Association of Perioperative Registered Nurses (AORN). These figures offer strong support for the argument that a new or renovated department of similar size and volume needs to: 1. Provide 24 hours of continuous coverage 2. Have a formal, documented system to log, investigate, and resolve complaints/issues reported by clinical users 3. Ensure that policies and procedures are in compliance with FDA, OSHA, state and local agencies, AAMI, and AORN. SPD Scope through Friday only. The need for continuous coverage holds across all types of facilities— urban, suburban, and rural—and in all regions represented. Under the clinical relationships tab, the results show that 86% of the facilities have a formal, documented system to log, investigate, and resolve complaints from clinical users. The remain260 Biomedical Instrumentation & Technology May/June 2013 Although 57% of the facilities indicate that they try to incorporate best practices into department activities, a comparison of these practices reveals that 71% have only a partial continuous quality improvement process in place. One facility is planning a future program and one facility has a comprehensive quality process in place. This finding indicates that most hospitals in this group are struggling to implement a comprehensive quality improvement process. A department that does have such a process in place, then, has a best practice in this area. Depending on the culture of the hospital administration, it may be difficult to get agreement on developing a comprehensive quality improvement process at a new or renovated facility. Additional work may be needed to justify implementation of a comprehensive quality improvement process. Current Sterilization Procedures And Practices A review of the information under the performance tab indicates that the majority © Copyright AAMI 2013. Single user license only. Copying, networking, and distribution prohibited. Columns and Departments of facilities are monitoring traffic control, temperature and humidity, area cleanliness, lighting, and error rates in each of the major areas: cleaning and decontamination, preparation and packaging, sterilization, and sterile storage. Additional items specific to each of the areas are also being monitored by the majority of facilities. In cleaning and decontamination, the majority of facilities also monitor cleaning verification, documentation of cleaning/decontamination, inspection of decontaminated items, and equipment repairs. In preparation and packaging, the majority of facilities also monitor correct composition of instrument sets, correct packaging methods, inspection of instruments, and inspection of rigid sterilization containers. In sterilization, the majority of facilities also monitor sterilizer loading/ unloading procedures, sterilization parameters, documentation of physical, biological and chemical monitoring, and incidence of Biomedical Instrumentation & Technology May/June 2013 261 © Copyright AAMI 2013. Single user license only. Copying, networking, and distribution prohibited. Columns and Departments positive biological indicators or chemical indicators (BIs/CIs), incidence of wet pack, steam quality issues, and equipment repairs. Based on this information, a new or renovated department will need to ensure that a comprehensive process is in place to monitor the majority of aspects of sterile processing. The current practices tab shows the percentage of hospitals that are using: 1. Rigid sterilization containers versus wrapping trays/sets 2. Reusable versus disposable textile packs 3. Reusable versus disposable basins 4. Reusable versus disposable surgical gowns and drapes To develop a “green” sustainable culture, a higher percentage of rigid sterilization containers, reusable textile packs, reusable basins, and reusable surgical gowns and drapes are needed. 262 Biomedical Instrumentation & Technology May/June 2013 To develop a “green” sustainable culture, a higher percentage of rigid sterilization containers, reusable textile packs, reusable basins, and reusable surgical gowns and drapes are needed. This comparison can help determine space allocation as reusable products and containers will require more storage space than disposable alternatives. The second section on this tab shows the approximate percentage of sterilization loads that are run for each modality. Analysis of this section indicates that all the hospitals in the comparison have eliminated the use of ethylene oxide and glutaraldehyde as sterilization processes. Based on this information, providing either of these sterilization modalities in a new or renovated department will most likely not be needed. If the facility has some items that require one of these sterilization methods, this information supports the idea that these items should be replaced with other product that can be sterilized by the other processes. © Copyright AAMI 2013. Single user license only. Copying, networking, and distribution prohibited. Columns and Departments It is unlikely that these methods need to be included in a new or renovated department. The error rate section shows that a maximum of two sterilization loads containing implants were released without the BI results in a year. The average is only one such incident per year. This finding lends strong support to the idea that processes should be established to minimize the risk of any sterilization loads containing an implant being released without BI results. Such processes may require additional instrument sets. The analysis also reveals that single- and multivariable CIs are not being used by the facilities in the example, thus providing justification on using the more comprehensive integrating and emulating type CIs. Overall error rates are found to be relatively low with a median of 59 incidents in 2011. The calculated error rate is just over zero. A low error rate indicates that a comprehensive monitoring program is in place and provides strong support that a similar program must be included in a new or renovated department. Productivity Analysis The SPB productivity analysis module can help predict the number of FTEs needed with an increase in the number of surgeries. For example, a facility is intending to recruit a new orthopedic surgeon who will perform five total hip and five total knee procedures per month. The trays and accessory items needed to perform a total hip and a total knee procedure are known. In this example, each case will need: 1. Two peel pack items (intensity value 1) a. (Two items x 10 procedures per month) x 12 months per year = 240 additional intensity value 1 items per year; 2. One surgical case cart per procedure per month (intensity value 2) a. (One case cart x 10 procedures per month) x 12 months per year = 120 additional intensity value 2 items per year; 3. Two basic orthopedic trays are needed for each total joint procedure (intensity value 2) a. (Two trays x 10 procedures per month) x 12 months per year = 240 additional intensity value 2 items per year; 4. Three complex orthopedic trays are needed for each total joint procedure (intensity value 3), a. (Three trays x 10 procedures per month) x 12 months = 360 additional intensity value 3 items per year; 5. 10 trays of complex loaner instruments are needed for each total joint procedure (intensity value 4), a. (10 trays x 10 procedures per month) x 12 months = 1200 additional intensity value 4 items per year. Biomedical Instrumentation & Technology May/June 2013 263 © Copyright AAMI 2013. Single user license only. Copying, networking, and distribution prohibited. Columns and Departments be added into the program (delete the current information and replace with the data for the changes). Keep a record of the current information so that it can be added back later. After all data for the change is entered, look at the FTE results tab. The SPB tool will have calculated the FTEs needed, and a chart can be printed showing these results. This data could provide a powerful argument for obtaining approval for additional FTEs. Staffing To calculate the number of FTEs needed, multiply each of the additional work load items above by the time needed for each intensity value. 1. 240 intensity value 1 items x 15 minutes = 3,600 minutes per year 2. 120 intensity value 2 items x 30 minutes = 3,600 minutes per year 3. 240 intensity value 2 items x 30 minutes = 7,200 minutes per year 4. 360 intensity value 3 items x 40 minutes = 14,400 minutes per year 5. 1200 intensity value 4 items x 75 minutes = 90,000 minutes per year Total minutes needed per year to process the additional surgical instruments/case carts for 10 additional total joint procedures per month are 118,800 minutes or 1,980 hours, almost 1 FTE. Additional time needs to be added for vacation and holiday coverage as well as personal, fatigue, and delay factors. This information strongly supports the need to hire additional personnel to handle the additional work. That was a simple example. More complex changes in surgical volume can also be determined by using the SPB program. The data for expected changes can 264 Biomedical Instrumentation & Technology May/June 2013 Continuing with the same example, when looking at staffing for best practices, 25% of the departments have a quality assurance (QA) staffer, 25% have an instrument tracking person, and 50% have a dedicated SPD educator. It follows then, that for a new or renovated department, inclusion of these positions translates into a best practice in this area. Still, depending on the culture of the hospital administration, it may be difficult to reach agreement on the need for these positions. This is another area where additional information could bolster the argument for these positions. This section also shows information on certification of the staff and manager. According to the data, most departments do not have a majority of certified staff employees or managers. Seventy-five percent require staff to be certified within two years of employment, so these numbers should rise in future years. All of the managers are certified technicians, but only 50% have management certification. When looking at best practices, this information can be used to underscore the need for requiring certification of both staff and management personnel. Resources In the resources module of the SPB tool, the most helpful information for designing a new or renovated department can be found in the tab on computer resources. According to the information under this tab, 67% of departments have a computerized management system for instrument tracking in place. Some facilities also include computerized management of staffing and payroll. All departments have access to the organization’s intranet. Most departments have access to various online resources: e-mail, internet, AAMI, and the © Copyright AAMI 2013. Single user license only. Copying, networking, and distribution prohibited. Columns and Departments International Association of Healthcare Central Service Material Management (IAHCSMM). The data suggests that a modern sterile processing department must have computerized systems to manage the work that is performed. This information provides justification for providing these types of resources in the new/renovated department. Conclusion The discussion above shows many ways in which the AAMI SPB tool can be used to help design and staff a new or renovated department. A majority of departments provide for 24-hour coverage. Policies and procedures must be kept up to date and in compliance with FDA, OSHA, state and local agencies, AAMI, and AORN. Formal, documented systems to log, investigate, and resolve complaints reported by clinical users are needed. A continuous quality improvement program is needed for the department to be considered one of the best. A comprehensive monitoring program is needed to ensure compliance with regulatory agencies and department policies and procedures. Analysis of predicted numbers of surgical procedures can be used to determine staffing requirements. Staff also needs to be well trained and certified. Computerized management systems are needed to ensure that the department operates at optimum efficiency and does so effectively. SPB is a powerful tool that can be used to justify decisions made in the design of the new renovated department. n A comprehensive monitoring program is needed to ensure compliance with regulatory agencies and department policies and procedures. AAMI ST79 Sterilization Posters Colorful, eye-catching, and informative, this set of five posters are a quick reference guide. Pulled from ST79, the posters focus on: Immediate-Use Steam Sterilization Loading the Sterilizer Sterilization Cycle Monitoring Sterilization Process Failures Checklist to Identify Reasons for Steam Sterilization Process Failures These 18” x 24” posters are laminated to extend their life and allow for cleaning. Order Code: POSTER-S List: $89 / AAMI member: $59 To order, call +1-877-249-8226 or visit www.aami.org/publications/posters/posters.html SOURCE CODE: PB Biomedical Instrumentation & Technology May/June 2013 265
