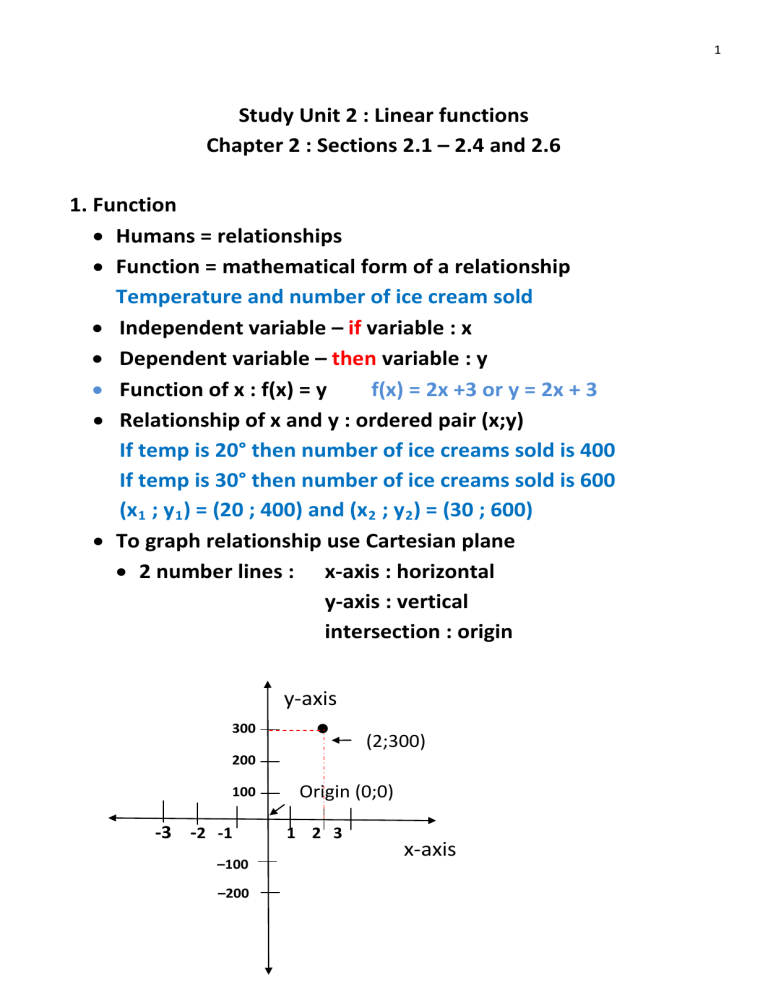
1 Study Unit 2 : Linear functions Chapter 2 : Sections 2.1 – 2.4 and 2.6 1. Function • Humans = relationships • Function = mathematical form of a relationship Temperature and number of ice cream sold • Independent variable – if variable : x • Dependent variable – then variable : y • Function of x : f(x) = y f(x) = 2x +3 or y = 2x + 3 • Relationship of x and y : ordered pair (x;y) If temp is 20° then number of ice creams sold is 400 If temp is 30° then number of ice creams sold is 600 (x 1 ; y 1 ) = (20 ; 400) and (x 2 ; y 2) = (30 ; 600) • To graph relationship use Cartesian plane • 2 number lines : x-axis : horizontal y-axis : vertical intersection : origin y-axis 300 (2;300) 200 100 -3 -2 -1 –100 –200 Origin (0;0) 1 2 3 x-axis 2 2. Linear function • Relationship between 2 variables is linear and graph is a straight line y = mx + c or y = ax +b with y and x variables and m and c values and (x 1 ;y 1 ) and (x 2 ;y 2 ) are 2 points on the line. o m = slope or how steep is line or how does y-values change if x values change y −y m= 2 1 x 2 − x1 o c = y-intercept : cut y-axis : where x = 0 y-axis y = mx + c y2 − y1 x 2 − x1 m positive m=slope = y2 y1 y-intercept = c x=0 (0;c) x1 x-intercept y=0 (x;0) x2 x-axis 3 Other lines: y-axis y = –mx + c m = slope = negative x=5 y-intercept = c x=0 y=2 x-axis x-intercept y =0 • If two lines are parallel they have the same slope 4 • How to determine equation of line: o Need 2 points on line (x1 ;y 1 ) and (x 2 ;y 2) 1. Calculate m = y2 − y1 x 2 − x1 2. Substitute m and any one of the 2 points into function y = mx + c to determine c No 3a of discussion class • How to draw a line: o Need two points on line or o Equation of line 1. Calculate any 2 points on line by choosing a x-value and calculate the y-value No 3b of discussion class 5 Question 3a Find the equation of the line passing through the points (1; 20) and (5; 60). Solution y = mx + c. Let (x 1 ; y 1 ) = (1 ; 20) and (x2 ; y 2 ) = (5 ; 60) The slope m is = m y2 − y1 60 − 20 40 = = = 10 5 −1 4 x2 − x1 Therefore y = 10x +c. Substitute any one of the points into the equation of the line to determine c. Let’s choose the point (1 ; 20). Then = y 10 x + c 20 = 10 × 1 + c 20 = 10 + c −c = 10 − 20 −c =−10 c = 10 The equation of the line is= y 10 x + 10 . 6 Question 3 b Draw the graph of the line y = 10 x + 10. Solution Need two points to draw line : Choose any x or y value and calculate y or x: Choose x = 0 then y = 10 (0) + 10 y = 10 -> point 1 = (0 ; 10) Choose y = 0 then 0 = 10x + 10 –10x = 10 x = 10/–10 x = –1 -> point2 = (–1 ; 0) y-axis y = 10x + 10 30 20 (–1;0) -3 -2 (0;10) 10 -1 –10 –20 1 2 3 x-axis 7 • How to determine a slope, y-intercept and x-intercept if given the equation of a line: for example 3x + 4y – 8 = 4 or y = 4x +20 1. Write it in the format y = mx + c 2. Compare with standard form => slope is m, y-intercept is c 3. To calculate the x-intercept make y = 0 and solve for x 1. Write in format y = mx +c 3x + 4y – 8 = 4 4y = 4 + 8 – 3x 4y = 12 – 3x y = 12/4 – 3/4x y = 3 – 3/4x 2. slope = m = –3/4 y-intercept = c = 3 x-intercept is where y = 0 but y = 3 – 3/4x 0 = 3 – 3/4x 3/4x = 3 x = 3 × 4/3 x = 12/3 x=4 8 3. Application in economics Relationship between price P and quantity Q of a product • Demand function • If the price of a product ↑ then the demand ↓ • P = a – bQ with • a = y-intercept (c) • b = slope = negative P a Q • Supply function • If the price of a product ↑ then the supply ↑ • P = c + dQ with • c = y-intercept • d = slope = positive P c Q 9 Cost function Fixed cost • Cost Variable cost dependent on quantity Q • TC = FC + VC x Q => y = c + mx A supermarket’s fixed cost is R5000 per month and the salary per employees is R2000 per month. What is the supermarket’s linear cost function if the number of employees is Q? Cost = 5000 + 2000Q • Revenue • What you earn • R = Price x Quantity • R = P x Q => px • Profit • Revenue – cost • Depreciation A R200 000 car depreciates linearly to R40 000 in 8 years’ time. Derive a linear equation for the value of the car after x years with 0 ≤ x ≤ 8. 10 Let y = value and x = time or years y = mx + c Need two points on graph: Given (8; 40 000) and (0; 200 000) Now m = y2 − y1 40000 − 200000 −160000 = = = −20000 x2 − x1 8−0 8 y = –20 000x + c Take any one of two points: Say point 2 200 000 = -20 000(0) + c c = 200 000 Depreciation : y = –20 000x + 200 000 11 • Elasticity • Important in economics • Think what happens with an elastic band: if you apply little pressure the band expand a little bit and if you apply a lot of pressure the band expand a lot. • How sensitive demand is for price change • If the price P and % change in price goes up or down what will happen to the % change in quantity • Ratio of % change % change in demand • ε= % change in price • Price elasticity of demand or supply o Point : At a point o Arc : Over an interval 1. Price elasticity of demand • Point (P 0 ;Q 0) Demand : P = a – bQ 1 P εd = − • 0 b Q0 • In terms of P 1 P P εd = − • = b Q P−a Discussion class 4a + 4b 12 Question 4a If the demand function is P = 80 – 2Q, where P and Q are the price and quantity respectively, determine the expression for price elasticity of demand if the price P = 20. Solution Now 1 b εd = − P Q Given P = 80 – 2Q and P = 20. Comparing P = 80 – 2Q with P = a – bQ –> a = 80 and b = 2. To determine the value of Q we substitute P = 20 into the equation and solve for Q 20 = 80 – 2Q 20 – 80 = – 2Q −60 =Q −2 Q = 30 Now 13 εd = = = = 1 P − b Q 1 20 − 2 30 1 − 3 − 0,33 At P = 20 a 1% increase (decrease) in price will cause a 0,33% decrease (increase) in the quantity demanded Question 4 b If the demand function is P = 80 – 2Q, where P and Q are the price and quantity respectively, determine the expression for price elasticity of demand in terms of P only. Solution Now demand in terms of P εd = P P−a Given P = 80 – 2Q and P = 20. Comparing P = 80 – 2Q with P = a – bQ,–> a = 80 and b = 2. Thus εd = P . P − 80 14 • Arc Over an interval Use the average P and Q at beginning and end of interval. P 1 → P2 and Q 1 →Q 2 1 P +P εd = − • 1 2 b Q 1 +Q 2 Discussion class 5 Question 5 Given the demand function P = 60 – 0,2Q where P and Q is the price and quantity respectively, calculate the arc price elasticity of demand when the price decreases from R50 to R40. Solution 1 P+P Arc elasticity of demand =− × 1 2 b Q1 + Q2 Given function P = 60 – 0,2Q, with a = 60 and b = 0, 2 Given P1 = 50 and P2 = 40. Need to determine Q 1 and Q 2 . P = 60 − 0, 2Q 0, 2Q = 60 − P = Q 300 − 5 P 15 Determine Q 1 and Q 2 by substituting P1 = 50 and P2 = 40 into the equation. Thus If P= 50 then Q= 300 − 5 × 50= 50 1 1 If P2= 40 then Q2= 300 − 5 × 40= 100 Therefore 1 P +P Elasticity of demand =− × 1 2 b Q1 + Q2 1 50 + 40 = − × 0, 2 50 + 100 1 90 = − × 0, 2 150 −90 = 30 = −3 2. Price elasticity of supply Demand : P = c + dQ 1 P εs = • 0 d Q0
