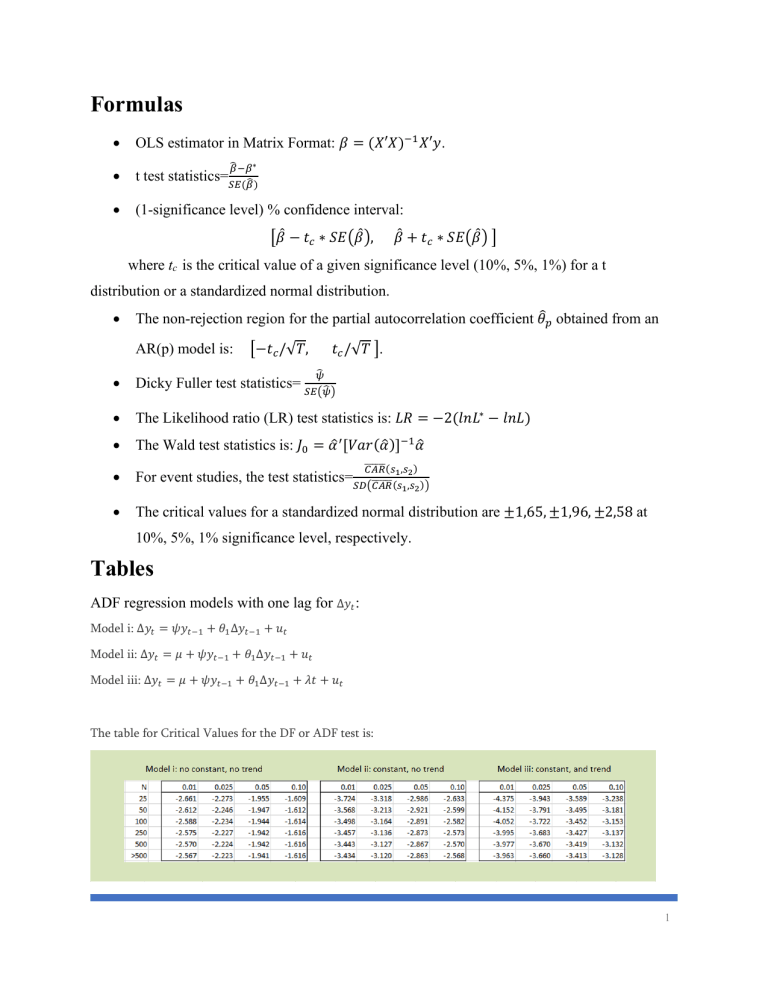
Formulas • OLS estimator in Matrix Format: 𝛽 = (𝑋′𝑋)−1 𝑋′𝑦. • t test statistics=𝑆𝐸(𝛽̂) • (1-significance level) % confidence interval: ̂ −𝛽 ∗ 𝛽 [𝛽̂ − 𝑡𝑐 ∗ 𝑆𝐸(𝛽̂ ), 𝛽̂ + 𝑡𝑐 ∗ 𝑆𝐸(𝛽̂ ) ] where tc is the critical value of a given significance level (10%, 5%, 1%) for a t distribution or a standardized normal distribution. • The non-rejection region for the partial autocorrelation coefficient 𝜃̂𝑝 obtained from an AR(p) model is: [−𝑡𝑐 /√𝑇, 𝑡𝑐 /√𝑇 ]. ̂ 𝜓 • Dicky Fuller test statistics= 𝑆𝐸(𝜓̂) • The Likelihood ratio (LR) test statistics is: 𝐿𝑅 = −2(𝑙𝑛𝐿∗ − 𝑙𝑛𝐿) • The Wald test statistics is: 𝐽0 = 𝛼̂ ′ [𝑉𝑎𝑟(𝛼̂)]−1 𝛼̂ • 1 For event studies, the test statistics=𝑆𝐷(𝐶𝐴𝑅 ̅̅̅̅̅̅ (𝑠 • The critical values for a standardized normal distribution are ±1,65, ±1,96, ±2,58 at ̅̅̅̅̅̅ 𝐶𝐴𝑅 (𝑠 ,𝑠2 ) 1 ,𝑠2 )) 10%, 5%, 1% significance level, respectively. Tables ADF regression models with one lag for ∆𝑦𝑡 : Model i: ∆𝑦𝑡 = 𝜓𝑦𝑡−1 + 𝜃1 ∆𝑦𝑡−1 + 𝑢𝑡 Model ii: ∆𝑦𝑡 = 𝜇 + 𝜓𝑦𝑡−1 + 𝜃1 ∆𝑦𝑡−1 + 𝑢𝑡 Model iii: ∆𝑦𝑡 = 𝜇 + 𝜓𝑦𝑡−1 + 𝜃1 ∆𝑦𝑡−1 + 𝜆𝑡 + 𝑢𝑡 The table for Critical Values for the DF or ADF test is: 1


