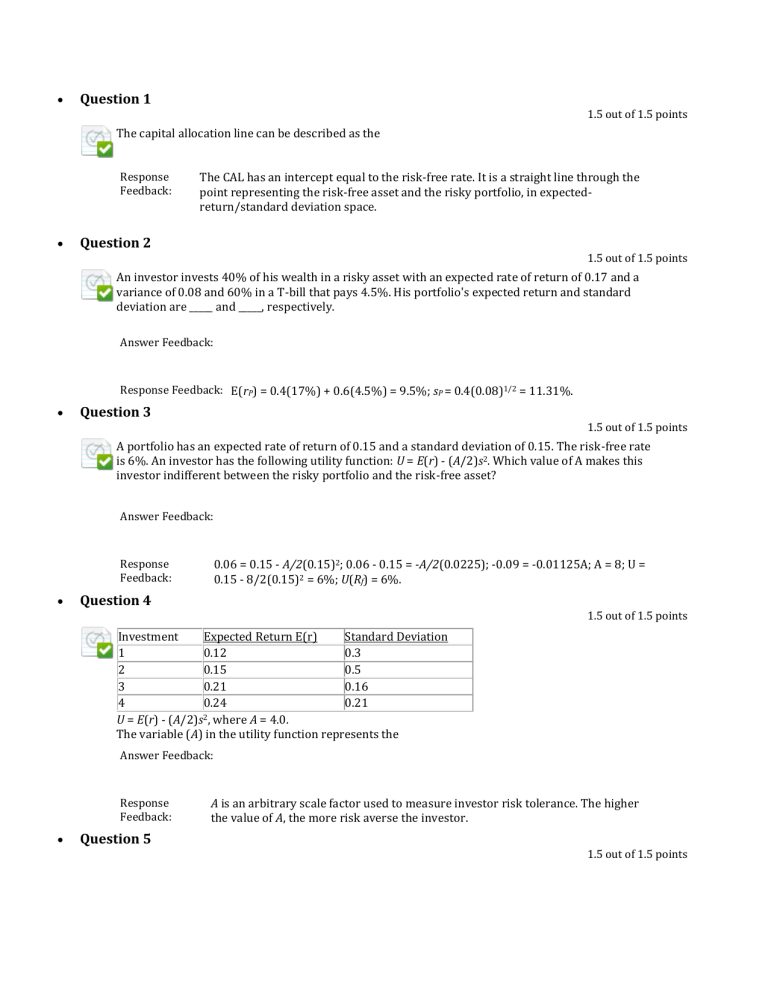
Question 1 1.5 out of 1.5 points The capital allocation line can be described as the Response Feedback: The CAL has an intercept equal to the risk-free rate. It is a straight line through the point representing the risk-free asset and the risky portfolio, in expectedreturn/standard deviation space. Question 2 1.5 out of 1.5 points An investor invests 40% of his wealth in a risky asset with an expected rate of return of 0.17 and a variance of 0.08 and 60% in a T-bill that pays 4.5%. His portfolio's expected return and standard deviation are _____ and _____, respectively. Answer Feedback: Response Feedback: E(rP) = 0.4(17%) + 0.6(4.5%) = 9.5%; sP = 0.4(0.08)1/2 = 11.31%. Question 3 1.5 out of 1.5 points A portfolio has an expected rate of return of 0.15 and a standard deviation of 0.15. The risk-free rate is 6%. An investor has the following utility function: U = E(r) - (A/2)s2. Which value of A makes this investor indifferent between the risky portfolio and the risk-free asset? Answer Feedback: Response Feedback: 0.06 = 0.15 - A/2(0.15)2; 0.06 - 0.15 = -A/2(0.0225); -0.09 = -0.01125A; A = 8; U = 0.15 - 8/2(0.15)2 = 6%; U(Rf) = 6%. Question 4 1.5 out of 1.5 points Investment Expected Return E(r) Standard Deviation 1 0.12 0.3 2 0.15 0.5 3 0.21 0.16 4 0.24 0.21 2 U = E(r) - (A/2)s , where A = 4.0. The variable (A) in the utility function represents the Answer Feedback: Response Feedback: Question 5 A is an arbitrary scale factor used to measure investor risk tolerance. The higher the value of A, the more risk averse the investor. 1.5 out of 1.5 points You invest $100 in a risky asset with an expected rate of return of 0.12 and a standard deviation of 0.15 and a T-bill with a rate of return of 0.05. What percentages of your money must be invested in the risky asset and the risk-free asset, respectively, to form a portfolio with an expected return of 0.09? Answer Feedback: Response Feedback: 9% = w1(12%) + (1 - w1)(5%); 9% = 12%w1 + 5% - 5%w1; 4% = 7%w1; w1 = 0.57; 1 - w1 = 0.43; 0.57(12%) + 0.43(5%) = 8.99%. Question 6 1.5 out of 1.5 points The certainty equivalent rate of a portfolio is Response Feedback: The certainty equivalent rate of a portfolio is the rate that a risk-free investment would need to offer with certainty to be considered equally attractive as the risky portfolio. Question 7 1.5 out of 1.5 points In a return-standard deviation space, which of the following statements is(are) true for risk-averse investors? (The vertical and horizontal lines are referred to as the expected return-axis and the standard deviation-axis, respectively.) I) An investor's own indifference curves might intersect. II) Indifference curves have negative slopes. III) In a set of indifference curves, the highest offers the greatest utility. IV) Indifference curves of two investors might intersect. Response Feedback: An investor's indifference curves are parallel (thus they cannot intersect) and have positive slopes. The highest indifference curve (the one in the most northwestern position) offers the greatest utility. Indifference curves of investors with similar riskreturn trade-offs might intersect. Question 8 1.5 out of 1.5 points You invest $100 in a risky asset with an expected rate of return of 0.11 and a standard deviation of 0.20 and a T-bill with a rate of return of 0.03. The slope of the capital allocation line formed with the risky asset and the risk-free asset is equal to Answer Feedback: Response Feedback: (0.11 - 0.03)/0.20 = 0.40. Question 9 1.5 out of 1.5 points Based on their relative degrees of risk tolerance Response Feedback: By determining levels of risk tolerance, investors can select the optimum portfolio for their own needs; these asset allocations will vary between amounts of risk-free and risky assets based on risk tolerance. Question 10 1.5 out of 1.5 points In the mean-standard deviation graph, the line that connects the risk-free rate and the optimal risky portfolio, P, is called Response Feedback: The capital allocation line (CAL) illustrates the possible combinations of a risk-free asset and a risky asset available to the investor. Question 11 1.5 out of 1.5 points The capital allocation line provided by a risk-free security and N risky securities is Response Feedback: The capital allocation line represents the most efficient combinations of the riskfree asset and risky securities. Only C meets that definition. Question 12 1.5 out of 1.5 points Security X has expected return of 7% and standard deviation of 14%. Security Y has expected return of 11% and standard deviation of 22%. If the two securities have a correlation coefficient of -0.45, what is their covariance? Response Feedback: Cov(rX, rY) = (-.45)(.14)(.22) = -.01386. Question 13 1.5 out of 1.5 points As the number of securities in a portfolio is increased, what happens to the average portfolio standard deviation? Answer Feedback: Response Feedback: Question 14 Statman's study showed that the risk of the portfolio would decrease as random stocks were added. At first the risk decreases quickly, but then the rate of decrease slows substantially, as shown in Figure 7.2. The minimum portfolio risk in the study was 19.2%. 1.5 out of 1.5 points Which of the following statement(s) is(are) false regarding the selection of a portfolio from those that lie on the capital allocation line? I) Less risk-averse investors will invest more in the risk-free security and less in the optimal risky portfolio than more risk-averse investors. II) More risk-averse investors will invest less in the optimal risky portfolio and more in the risk-free security than less risk-averse investors. III) Investors choose the portfolio that maximizes their expected utility. Answer Feedback: Response Feedback: All rational investors select the portfolio that maximizes their expected utility; for investors who are relatively more risk-averse, doing so means investing less in the optimal risky portfolio and more in the risk-free asset. Question 15 1.5 out of 1.5 points An investor who wishes to form a portfolio that lies to the right of the optimal risky portfolio on the capital allocation line must: Response Feedback: The only way that an investor can create a portfolio that lies to the right of the capital allocation line is to create a borrowing portfolio (buy stocks on margin). In this case, the investor will not hold any of the risk-free security, but will hold only risky securities. Question 16 1.5 out of 1.5 points Efficient portfolios of N risky securities are portfolios that Response Feedback: Portfolios that are efficient are those that provide the highest expected return for a given level of risk. Question 17 1.5 out of 1.5 points Consider an investment opportunity set formed with two securities that are perfectly negatively correlated. The global minimum variance portfolio has a standard deviation that is always Answer Feedback: Response Feedback: Question 18 If two securities were perfectly negatively correlated, the weights for the minimum variance portfolio for those securities could be calculated, and the standard deviation of the resulting portfolio would be zero. 1.5 out of 1.5 points Given an optimal risky portfolio with expected return of 12% and standard deviation of 26% and a risk free rate of 3%, what is the slope of the best feasible CAL? Answer Feedback: Response Feedback: Slope = (12 - 3)/26 = .346. Question 19 1.5 out of 1.5 points Nonsystematic risk is also referred to as Response Feedback: Market, systematic, and nondiversifiable risk are synonyms referring to the risk that cannot be eliminated from the portfolio. Diversifiable, unique, nonsystematic, and firm-specific risks are synonyms referring to the risk that can be eliminated from the portfolio by diversification. Question 20 1.5 out of 1.5 points Consider the following probability distribution for stocks A and B: State Probability Return on Stock A Return on Stock B 1 0.15 8% 8% 2 0.20 13% 7% 3 0.15 12% 6% 4 0.30 14% 9% 5 0.20 16% 11% The expected rates of return of stocks A and B are _____ and _____, respectively. Answer Feedback: Response Feedback: E(RA) = 0.15(8%) + 0.2(13%) + 0.15(12%) + 0.3(14%) + 0.2(16%) = 13%; E(RB) = 0.15(8%) + 0.2(7%) + 0.15(6%) + 0.3(9%) + 0.2(11%) = 8.4%.


