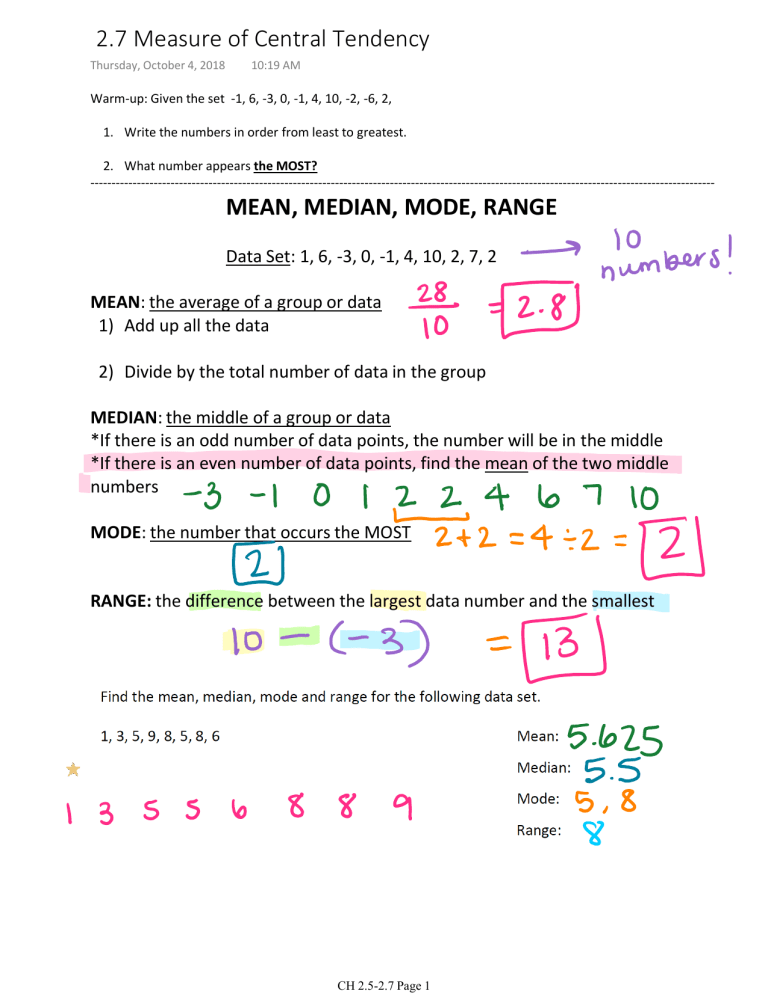
2.7 Measure of Central Tendency Thursday, October 4, 2018 10:19 AM Warm-up: Given the set -1, 6, -3, 0, -1, 4, 10, -2, -6, 2, 1. Write the numbers in order from least to greatest. 2. What number appears the MOST? ---------------------------------------------------------------------------------------------------------------------------------------------------- MEAN, MEDIAN, MODE, RANGE Data Set: 1, 6, -3, 0, -1, 4, 10, 2, 7, 2 MEAN: the average of a group or data 1) Add up all the data 2) Divide by the total number of data in the group MEDIAN: the middle of a group or data *If there is an odd number of data points, the number will be in the middle *If there is an even number of data points, find the mean of the two middle numbers MODE: the number that occurs the MOST RANGE: the difference between the largest data number and the smallest CH 2.5-2.7 Page 1 Pg. 2 [2.7] Data can be described by certain measures of central tendency. In general, *If the numbers are evenly distributed (close together), use the ____________________ to describe the data *If the data is skewed (numbers are not close together), use the ____________________ to describe the data. *If the data contains no numbers, use the __________________ to describe the data. Choose the best measure of central tendency. 1) Donations were collected for the sports fund. Amounts include: $50, $110, $78, $81, $92, $60, $500, $58, $75 _____________________ 2) Rylee scores the following points for her school's basketball game in the last 8 games: 16, 12, 12, 18, 14, 21, 20, 21 _____________________ 3) Coach Bates was looking to order new jerseys for the baseball team. His players are size S, M, L, L, M, XL, L, XL, M, L, S, L _____________________ a) Mean? b) Median? 4) c) Mode? d) Which is the best measure of central tendency and why? CH 2.5-2.7 Page 2 Pg. 3 [2.7] Solving an equation: Suppose your grades on three math exams are 80, 93, and 91. What grade do you need on your next exam to have a 90 average on the four exams? Write and solve an equation to find the value of x 85, 87, 81, 92, 87, 80,x ; mean: 85 Mean Absolute Deviation Steps: 1. Find the mean. -Add all the data values together and divide by how many there are. 2. Find the deviation from the mean. -Subtract the mean from each data value. 3. Find the absolute deviation. -Since distance cannot be negative, take the absolute value for the deviations found in step 2. 4. Find the Mean Absolute Deviation (MAD). -Add all the absolute deviations and divide by how many there are. CH 2.5-2.7 Page 3 Pg. 4 [2.7] Thursday, May 30, 2019 10:20 AM Interquartile Range CH 2.5-2.7 Page 4
