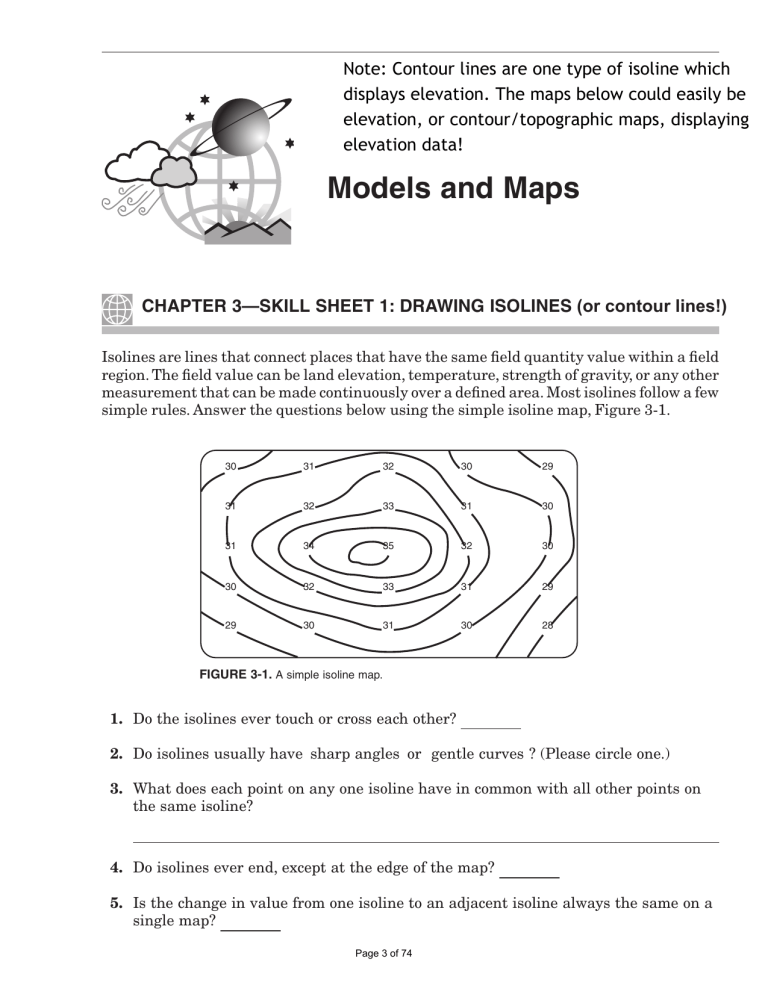
Note: Contour lines are one type of isoline which displays elevation. The maps below could easily be elevation, or contour/topographic maps, displaying elevation data! Models and Maps CHAPTER 3—SKILL SHEET 1: DRAWING ISOLINES (or contour lines!) Isolines are lines that connect places that have the same field quantity value within a field region. The field value can be land elevation, temperature, strength of gravity, or any other measurement that can be made continuously over a defined area. Most isolines follow a few simple rules. Answer the questions below using the simple isoline map, Figure 3-1. 30 31 32 30 29 31 32 33 31 30 31 34 35 32 30 30 32 33 31 29 29 30 31 30 28 FIGURE 3-1. A simple isoline map. 1. Do the isolines ever touch or cross each other? 2. Do isolines usually have sharp angles or gentle curves ? (Please circle one.) 3. What does each point on any one isoline have in common with all other points on the same isoline? They all have the same value. 4. Do isolines ever end, except at the edge of the map? No 5. Is the change in value from one isoline to an adjacent isoline always the same on a Yes single map? Page 3 of 74 Yes 6. Do isolines tend to make parallel curves? 7. Does every isoline have one side where the values are higher and another side Yes where the values are lower? It is best to use a pencil whenever you draw isolines. Nearly everyone finds that they have to make erasures as a part of correcting errors. Draw isolines on Figure 3-2 at an interval of 1. Please work neatly. 13 15 16 16 18 12 13 14 15 17 11 12 13 14 15 10 12 13 15 16 FIGURE 3-2. On Figure 3-3, construct an isoline map with an interval of 5. –7 –2 0 2 8 12 16 9 –9 –4 3 5 9 15 15 10 –11 –5 5 8 14 20 18 11 –10 –4 5 11 15 22 18 10 –5 0 6 10 14 15 13 8 –3 0 7 9 10 8 4 2 –5 –1 5 5 5 2 –1 –6 FIGURE 3-3. 8. Define isoline: A line that connects points of equal value within a field region. (The word “field” is not required.) Page 4 of 74
