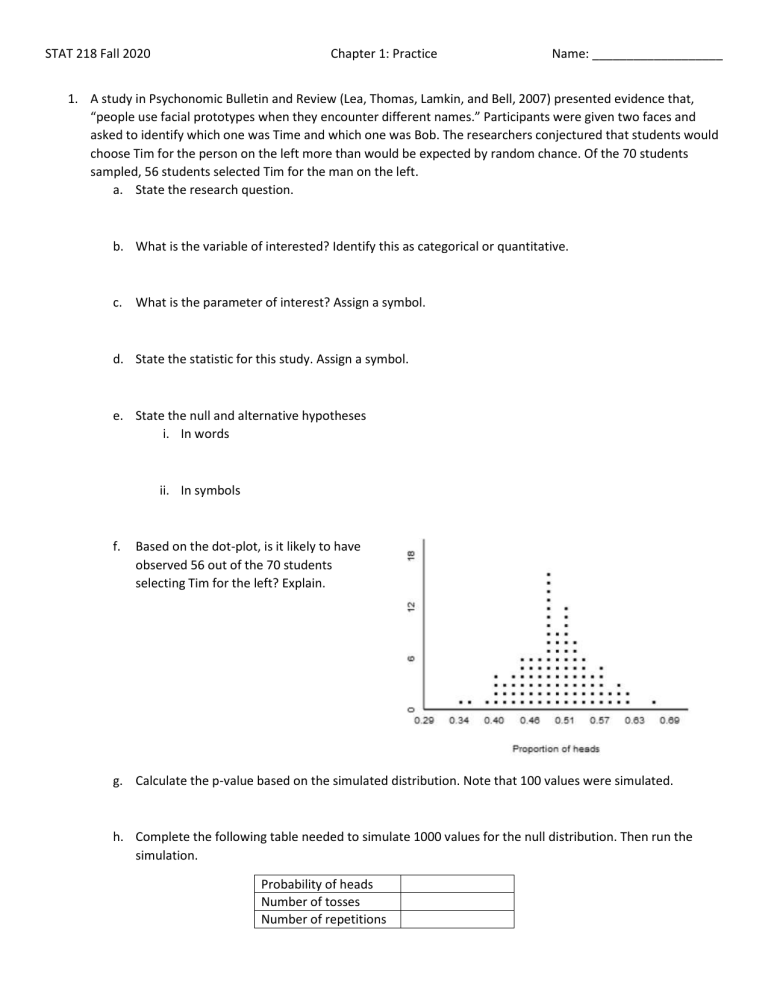
STAT 218 Fall 2020 Chapter 1: Practice Name: ___________________ 1. A study in Psychonomic Bulletin and Review (Lea, Thomas, Lamkin, and Bell, 2007) presented evidence that, “people use facial prototypes when they encounter different names.” Participants were given two faces and asked to identify which one was Time and which one was Bob. The researchers conjectured that students would choose Tim for the person on the left more than would be expected by random chance. Of the 70 students sampled, 56 students selected Tim for the man on the left. a. State the research question. b. What is the variable of interested? Identify this as categorical or quantitative. c. What is the parameter of interest? Assign a symbol. d. State the statistic for this study. Assign a symbol. e. State the null and alternative hypotheses i. In words ii. In symbols f. Based on the dot-plot, is it likely to have observed 56 out of the 70 students selecting Tim for the left? Explain. g. Calculate the p-value based on the simulated distribution. Note that 100 values were simulated. h. Complete the following table needed to simulate 1000 values for the null distribution. Then run the simulation. Probability of heads Number of tosses Number of repetitions STAT 218 Fall 2020 i. Chapter 1: Practice Name: ___________________ Find the standard deviation of the null distribution based on 1000 simulations. Calculate the standardized statistic. (Make sure to switch from “Number of successes” to “Proportion of successes”) Standard deviation = Standardized statistic = j. Based on the standardized statistic and p-value, state whether you would reject or fail to reject the null hypothesis. k. Write a conclusion in context. 2. A teacher read somewhere that it’s been conjectured that when people are asked to choose a number from the choices 1, 2, 3, 4, and 5 they tend to choose “3” more than would be expected by random chance. To investigate this, she collected data in her class. Here is the table of responses from her students. “1” 7 “2” 4 “3” 9 “4” 5 “5” 5 a. State the research question. b. What is the variable of interest? Identify this as categorical or quantitative. c. What is the parameter of interest? Assign a symbol. d. What is the sample size? Assign a symbol. e. State the statistic for this study. Assign a symbol. f. State the null and alternative hypothesis. a. In words b. In symbols g. Based on the dot-plot to the right, is it likely to have observed 9 out of 30 students selecting “3”? Explain. STAT 218 Fall 2020 Chapter 1: Practice h. Calculate the p-value based on the simulated distribution. Note that 100 values were simulated. i. Name: ___________________ Complete the following table needed to simulate 1000 values for the null distribution. Run the simulation. Probability of heads Number of tosses Number of repetitions j. Find the standard deviation of the null distribution based on 1000 simulation. Calculate the standardized statistic. (Make sure to switch from “Number of successes” to “Proportion to successes”) Standard deviation = Standardized statistic = k. Based on the standardized statistic and p-value, state whether you would reject or fail to reject the null hypothesis. l. Write a conclusion in context.


