International Journal of Trend in Scientific Research and Development (IJTSRD)
Volume 4 Issue 5, July-August 2020 Available Online: www.ijtsrd.com e-ISSN: 2456 – 6470
Determination of Local Site Effects in Taikkyi Area,
Yangon Region by using Microtremor Observations
Ohnmar Khine, Kyaw Kyaw
Department of Civil Engineering, Yangon Technological University, Yangon, Myanmar
ABSTRACT
Considering the possible local site effect is one of the most important facts in
seismic hazard assessment. Depending on the local site condition, the
characteristics of the seismic waves propagated through different geological
layers and amplified the surface ground motion. In this study, one of the
geophysical method of microtremor observations were carried out at 112 sites
throughout the Taikkyi area. After analyzing the recorded microtremor
observed data by Cygwin Software, we determined the horizontal to vertical
spectral ratio (HVRs) that reflects the local site effects of the study area. The
main outcomes of this research is to develop the fundamental frequency map
and peak amplitude or soil amplification map of Taikkyi area. According to the
evaluation results, the fundamental frequency is ranging from 1 to 2.3 Hz and
most parts of Taikkyi area show in the range of 1.3 to 1.6 Hz. The peak
amplitude of HVRs (potential soil amplification) is ranging from 1.5 to 3.6 and
most parts of the area are in the range of 1.5 to 2.5.
How to cite this paper: Ohnmar Khine |
Kyaw Kyaw "Determination of Local Site
Effects in Taikkyi Area, Yangon Region by
using
Microtremor
Observations"
Published
in
International Journal
of Trend in Scientific
Research
and
Development (ijtsrd),
ISSN:
2456-6470,
Volume-4 | Issue-5,
IJTSRD33203
August
2020,
pp.1591-1595,
URL:
www.ijtsrd.com/papers/ijtsrd33203.pdf
Copyright © 2020 by author(s) and
International Journal of Trend in Scientific
Research and Development Journal. This
is an Open Access article distributed
under the terms of
the
Creative
Commons Attribution
License
(CC
BY
4.0)
(http://creativecommons.org/licenses/by
/4.0)
KEYWORDS: microtremor, Horizontal-to-Vertical Spectral Ratio (HVRs),
fundamental frequency, peak amplitude
I.
INTRODUCTION
Myanmar is exposed to a major earthquake since it lies in the
Alpide Earthquake Belt, one of the two main Earthquake
Belts of the world. According to the historical seismic events,
the main seismic sources for earthquake potentials in
Myanmar are subduction zone Indian Plate beneath Burma
Plate, Sagaing fault and Kyaukkyan fault. The well- known
active Sagaing fault is trending roughly north-south, which
may cause large destructive earthquakes in Myanmar.
Therefore, Myanmar is an earthquake prone country and is
vulnerable to hazards from moderate to large magnitude
earthquakes.
The study area, Taikkyi is located in the northern part of
Yangon and this area is also near West Bago Yoma fault and
Saging fault. Taikkyi is frequently suffered from the
moderate earthquakes with magnitude, Mw 4 to 5. In 2017, a
moderate earthquake with magnitude 5.1 occurred near
Taikkyi area on 13 March. Taikkyi is the most severe affected
by this earthquake and after the main shock, average
magnitude of less than 4.5 occurred on the following days.
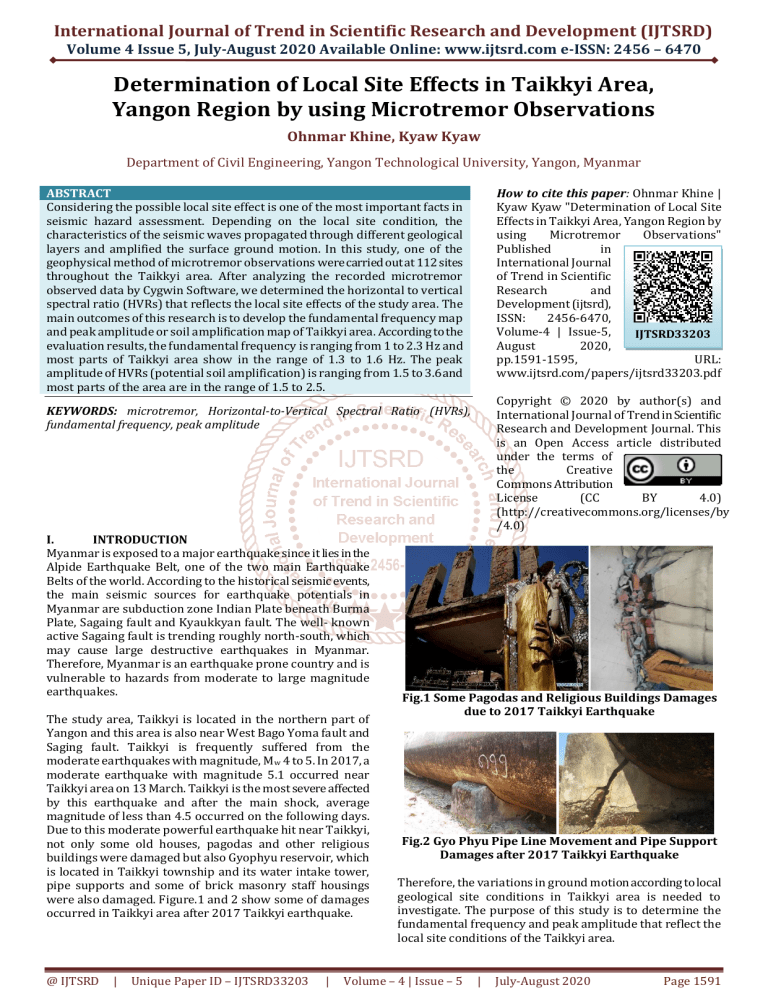
Due to this moderate powerful earthquake hit near Taikkyi,
not only some old houses, pagodas and other religious
buildings were damaged but also Gyophyu reservoir, which
is located in Taikkyi township and its water intake tower,
pipe supports and some of brick masonry staff housings
were also damaged. Figure.1 and 2 show some of damages
occurred in Taikkyi area after 2017 Taikkyi earthquake.
@ IJTSRD
|
Unique Paper ID – IJTSRD33203
|
Fig.1 Some Pagodas and Religious Buildings Damages
due to 2017 Taikkyi Earthquake
Fig.2 Gyo Phyu Pipe Line Movement and Pipe Support
Damages after 2017 Taikkyi Earthquake
Therefore, the variations in ground motion according to local
geological site conditions in Taikkyi area is needed to
investigate. The purpose of this study is to determine the
fundamental frequency and peak amplitude that reflect the
local site conditions of the Taikkyi area.
Volume – 4 | Issue – 5
|
July-August 2020
Page 1591
International Journal of Trend in Scientific Research and Development (IJTSRD) @ www.ijtsrd.com eISSN: 2456-6470
II.
STUDY REGION
Taikkyi, located in the northern part of Yangon district,
is situated at latitude 17˚30'0" N and longitude 96˚02'00" E.
The location of the study area is shown in Figure 3.
Fig. 3 Location Map of the Study Region
Taikkyi is located low to medium seismicity region. Taikkyi
is also near the main seismic sources of the Indian-Burma
plate’s subduction in the west, West Bago Yoma fault in the
north east and Sagaing fault in the east. The geological
structure of Taikkyi area is underlaid by alluvial deposits of
Bago Yoma fan. The alluvial deposits can be found in the
flood plains and they have the texture of gravel, clay, silts,
sand and laterite. [3]
Taikkyi is mainly composed of eight wards; Bu Tar, Oake
Pone Su, Shan Su, Mingalar, Bawdikone, Inngalar, Zayy and
Ooe Tann ward. To develop the fundamental frequency and
soil amplification map, geophysical measurements were
observed for these eight wards to cover the whole study
region.
III.
MICROTREMOR OBSERVATIONS
The surface of the earth is always in motion at seismic
frequencies, even without earthquakes. These constant
vibrations of the earth’s surface are called microseisms or
microtremors and its amplitude is generally too small (10-4
to 10-2 mm) to be felt by human senses. (Okada, 2003)
Microtremor represents a low energy wave field consisting
of interfering wave propagation from a range of different
sources and directions at many frequencies. Microtremors
with frequencies above 1 Hz are generally associated with
man-made cultural sources, while those below 1 Hz are
associated with natural phenomena.
There are two methods that can be applied in microtremor
measurement method. The first method is the single station
method, where a three component record from a single
geophone is processed to provide a spectrum of horizontal
to vertical particle motion ratio. Another method is the array
measurement method, which can obtain the propagation
velocities of Rayleigh waves by measuring plural
instruments simultaneously. In this research, applications
and interpretation of single station microtremor method
proposed by Nakamura (1989) is used. According to
Nakamura, 1989, the microtremor measurements can be
used to determine the characteristics of ground motions.
Therefore, the characteristics of measured microtremor data
is very useful to quantify the effects of local geological site
conditions and dynamic characteristics of the subsoil.
@ IJTSRD
|
Unique Paper ID – IJTSRD33203
|
The HVRs or Nakamura’s technique, which is simply based
on calculation of spectral ratios of Fourier spectra of
horizontal to vertical microtremor velocity components to
determine H/V spectral ratio and is especially recommended
in low to moderate seismicity areas. There are generally five
steps consist in evaluation of H/V spectral ratio: (1)
Separation of acceleration time historical data (2) Processing
for 40.96 sec recorded microtremor data (3) Performing Fast
Fourier Transform (4) Calculation of microtremor spectra
for NS/UD and EW/UD components and (5) Evaluation of
observed microtremor spectrum of H/V spectral ratio by
taking the average of NS/UD and EW/UD of microtremor
spectra. This H/V spectral ratio can be easily applied to
estimate the fundamental frequency and peak amplitude
(potential soil amplification) of subsurface soil structure
which are closely related to the geological conditions of the
site under study.
A. Microtremor Measurements throughout Taikkyi
Area
The single station microtremor measurements in Taikkyi
area were carried out by using the SMAR-6A3P microtremor
instrument with LS 8800 data logger as shown in Figure 4.
The sampling frequency was set at 100 Hz for all
measurements and the global positioning system (GPS) was
used for time calibration. The site to site distance is
approximately 200 meter and the duration of the record
time was 30 minutes. Figure 5 shows the single station
microtremor measurement performing in Taikkyi. During
the measurements, the recordings must be free from local
noise sources, like e.g. passing pedestrians, vehicles or
operating machineries. Meteorological disturbances, e.g.
rainfall or gusty wind did not occur during the observation
period.
Fig. 4 SMAR-6A3P Microtremor Instrument
Fig. 5 Single station microtremor measurement in
selected site of Taikkyi
Volume – 4 | Issue – 5
|
July-August 2020
Page 1592
International Journal of Trend in Scientific Research and Development (IJTSRD) @ www.ijtsrd.com eISSN: 2456-6470
To provide enough spatial distributions of the study area, the
single microtremor observations of 112 sites were measured
as shown in Figure 6.
Fig.7 Microtremor Spectra of NS/UD and EW/UD
Components for the Selected Sites, TK-34, TK-73 and
TK-39
Fig.6 Locations of the Measurement Points in Taikkyi
Area
IV.
MICROTREMOR OBSERVED DATA AND ANALYSIS
RESULTS
A full microtremor record can be described by one vertical,
UD component and two horizontal components, NS and EW
component. The spectral ratio of horizontal to vertical
motion obtained by microtremor observations is called H/V
spectral ratio.
And then, the observed microtremor spectrum is calculated
by averaging the spectra of NS/UD and EW/UD components.
Figure 8 represents the observed microtremor spectrum for
the selected sites.
In this study, microtremor measurements were conducted at
112 sites and each site was measured for thirty minutes.
After digital signal processing and analyzing the
microtremor data for thirty minutes for each site, we
selected the good microtremor spectra from the results of
each ten minutes for the components (NS/UD and EW/UD)
as shown in Figure 7.
Fig. 8 Observed Microtremor Spectra of Selected Sites,
TK-34, TK-73 and TK-39
@ IJTSRD
|
Unique Paper ID – IJTSRD33203
|
Volume – 4 | Issue – 5
|
July-August 2020
Page 1593
International Journal of Trend in Scientific Research and Development (IJTSRD) @ www.ijtsrd.com eISSN: 2456-6470
A. Determination of Fundamental Frequency and Peak
Amplitude ( Soil Amplification)
In microtremor method, site effects are usually represented
in the form of frequency and peak amplitude. In this
research, based on the observed microtremor spectrum
obtained from the microtremor measurements, the peak
amplitude of H/V spectral ratio or potential soil
amplification and fundamental frequency had been
determined for each site.
The fundamental frequency of the ground shows the
geological structure of the local area since the fundamental
frequency has a relation to the soil thickness of the
underlying soil layers. Based on the analysis of fundamental
frequency calculated for all sites, we have prepared the
fundamental frequency map as shown in Figure 9. According
to this map, the frequency is ranging from 1 to 2.3 Hz and
most of the fundamental frequency are observed in 1.3 to 1.6
Hz. In this map, red colour represents the highest
fundamental frequency zone and yellow colour represents
the lowest frequency zone. High frequency zone is
dominated by shallow soil layers and observed lower
frequency zone can be expected by thicker sediment layers.
According to this map, the peak amplitude (soil
amplification) is observed to be ranged generally for 1.5 to
3.6 and most parts are in the range of 1.5 to 2.5. In this map,
red colour represents the highest amplitude zone and yellow
colour represents the lowest amplitude zone. Larger
potential soil amplification can be expected in high peak
amplitude zone and strong ground motion can occur in this
zone. After 2017 Taikkyi earthquake, monasteries in Bu Tar
ward and Mingalar ward were severely affected and many
damages occurred due to this earthquake. It is found that the
peak amplitude of HVRs value in these sites are encountered
in highest amplitude zone. Therefore we notice that soils
with lower shear wave velocity generally greater
amplification than the soils with higher shear wave velocity.
Fig.10 Peak Amplitude (Potential Soil Amplification
Map of Taikkyi Area
Fig.9 Fundamental Frequency Map of Taikkyi Area
Amplification of the ground motion refers to the increase in
the intensity of ground shaking that can occur due to local
geological conditions. During an earthquake, seismic waves
are released at the source and propagated through different
geological layers and then they amplified the surface ground
shaking depending on the local site conditions. Based on the
fundamental peak of the observed microtremor spectrum,
the peak amplitude of H/V spectral ratio is regarded as the
potential soil amplification of the measured site and soil
amplification map is developed as shown in Figure 10.
@ IJTSRD
|
Unique Paper ID – IJTSRD33203
|
V.
CONCLUSIONS
This research is intended to provide the reliable information
about the local site effects of the Taikkyi area by using one of
the geophysical approach of microtremor observations. The
main outcomes of this research are fundamental frequency
map and potential soil amplification map. The fundamental
frequency is ranging from 1 to 2.3 Hz. High frequency
represents that shallow soil layer is dominated and low
buildings will experience stronger shaking during an
earthquake whereas low frequency highlights that thicker
soil layer is expected and high-rise buildings will experience
stronger shaking than the low buildings. The variation of the
peak amplitude (potential soil amplification) in Taikkyi area
fall in the range of 1.5 to 3.6. Some high potential soil
amplification zones are observed in this research area and
after 2017 Taikkyi earthquake, the religious buildings in this
zone were mostly affected by this earthquake. Therefore, the
Volume – 4 | Issue – 5
|
July-August 2020
Page 1594
International Journal of Trend in Scientific Research and Development (IJTSRD) @ www.ijtsrd.com eISSN: 2456-6470
level of ground shaking in this zone will be stronger than the
other areas. The outcomes from this research are useful for
not only engineering purposes but also mitigation of the
seismic risk for Taikkyi area.
ACKNOWLEDGMENT
The author would like to acknowledge to my supervisor and
professors from the Yangon Technological University who
guided for this study and supported the instrument for
microtremor measurements.
[4] R. Tuladhar, F. Yamazaki, P. Warnitchai and J. Saita, “
Seismic microzonation of the greater Bangkok area
using Microtremor Observations”, Earthquake
Engineering and Structural Dynamics, 2004;33:211225
[5] D. Stankoa, S. Markusicb, S. Streleca, M. Gazdeka, “HVSR
analysis of seismic site effects and soil-structure
resonance in Varazdin city (North Croatia)” ,Soil
Dynamics and Earthquake Engineering 92 (2017) 666–
677
REFERENCES
[1] S. L. Kramer, “Geotechnical Earthquake Engineering”,
Prentice-Hall International Series in Civil Engineering
and Engineering Mechanics, 653 pp, 1996.
[6] S. Aswad, M. A Massinai , Syamsuddin, “Microtremor
Study of Site Effect for Disaster Mitigation and
Geotechnical Purpose” , the 2nd International
Conference on Science (ICOS), 2018, 012053
[2] Myo Thant, “Probabilistic Seismic Hazard Assessment
for Yangon Region, Myanmar”, ASEAN Engineering
Journal Part C Vol.3 No.2, December 2014.
[7] M. H. Nokhandan, J. R. Rad, N. H. Moghaddas, “Site
effects Evaluation in the Zabol City using Microtremor
measurement” , Proceedings of the 3rd IASME / WSEAS
International Conference on Geology and Seismology
[3] Hla Hla Aung, Third Edition, 2017 “Myanmar
Earthquake History”, pp 114-125.
@ IJTSRD
|
Unique Paper ID – IJTSRD33203
|
Volume – 4 | Issue – 5
|
July-August 2020
Page 1595


